


Insights Overview
GDB Insights is a set of tools to monitor and debug your deployments. The following tools are available to you within the GDB Insights area:
- Metrics - Visual representation of the history of the most relevant metrics, such as database metrics or server metrics.
- Query Logs - Historical log of your executed queries with relevant info such as execution time and errors.
- Running Queries - List of queries that are currently being executed in your database.
- Database Logs - Visualization of logs provided by the database, such as debug log or user log.
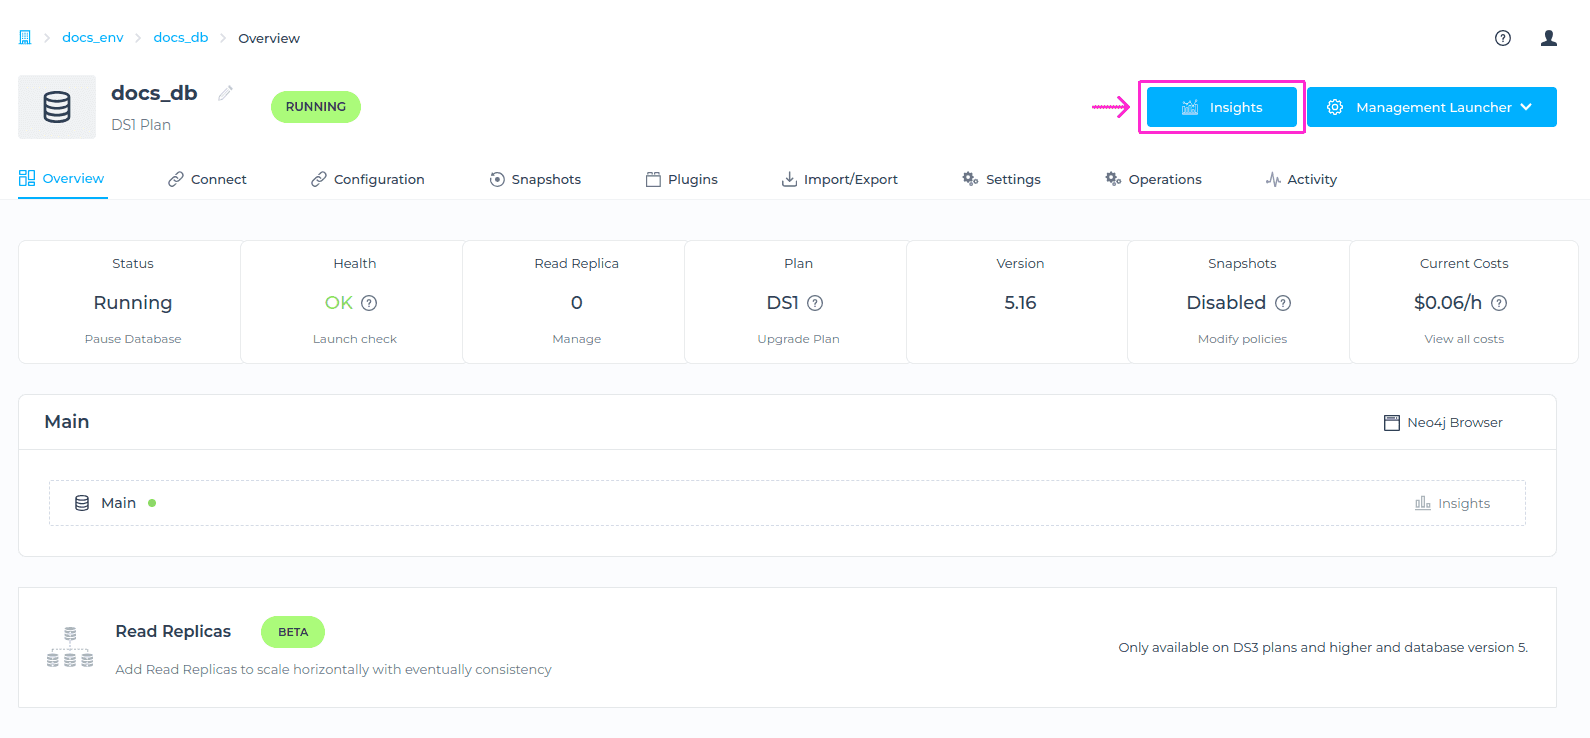
To locate this area, please navigate to the database you’d like to use Insighst tools for, and click on Insights button at the upper right.
Insights Settings
Prometheus endpoint
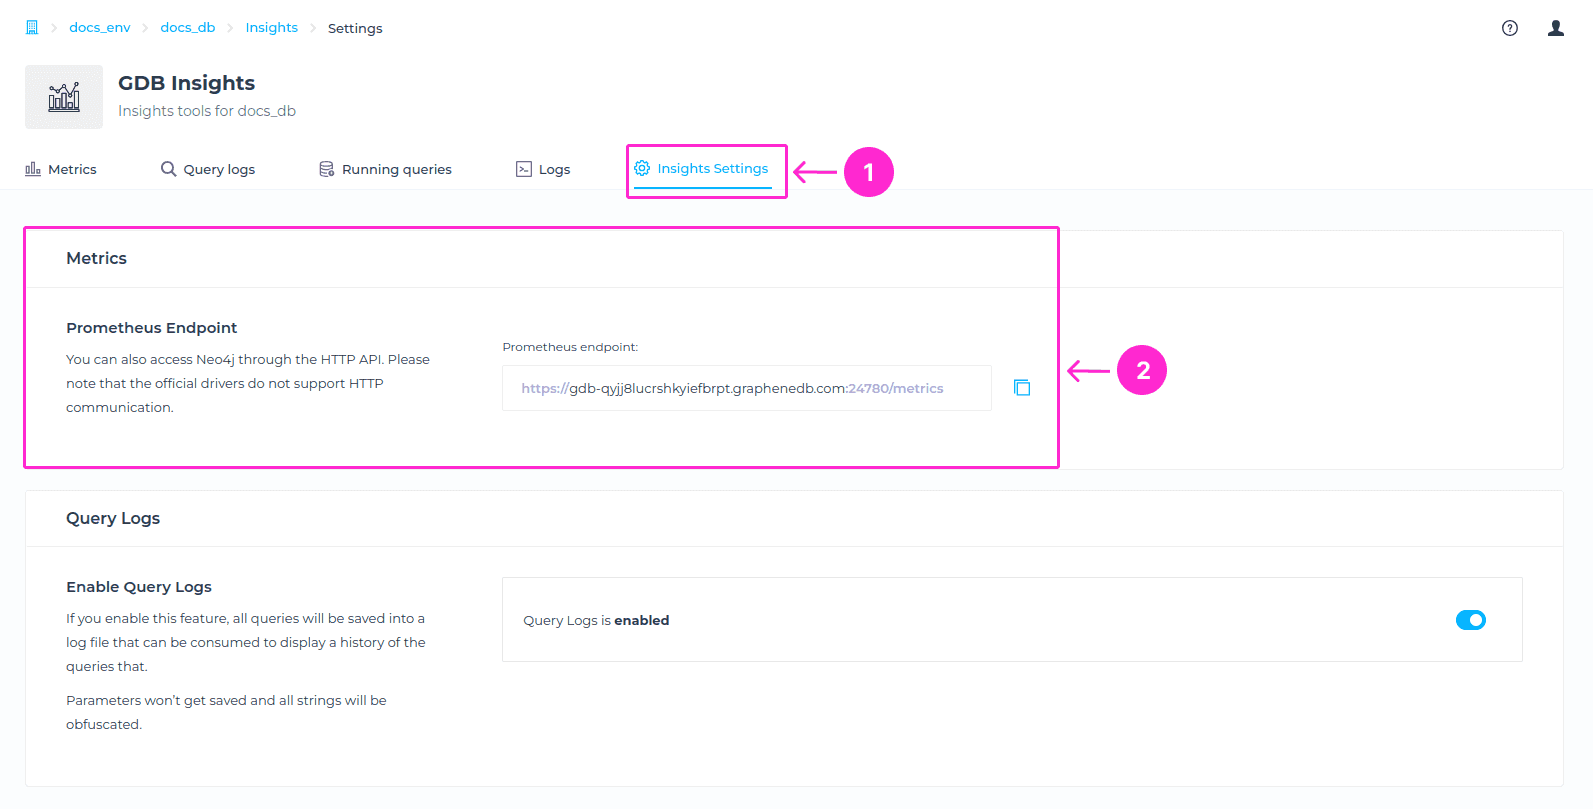
In the Insights Settings tab of Insighst area, we offer an endpoint for utilizing the open-source monitoring solution Prometheus.
To locate this endpoint, please navigate to the Insights Settings > Metrics section.
Enable/Disable Query Logging
The Query Logging feature is disabled by default, and you can easily enable it or later disable again without any downtime required. Simply navigate to the Insights Settings tab > Query Logs section > and enable or disable query logging with a toggle.
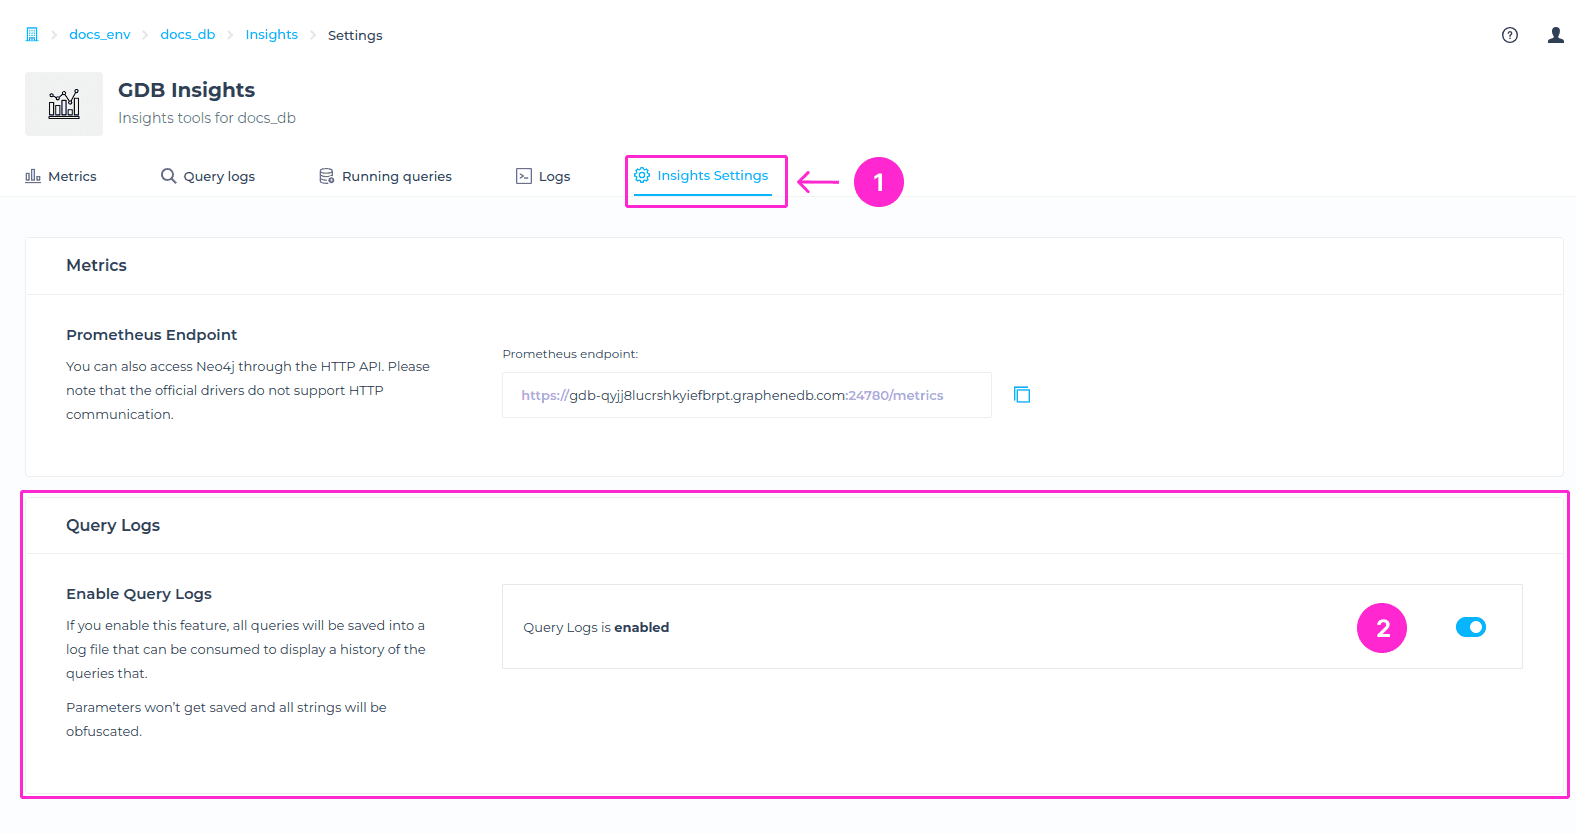
If you enable this feature, all queries will be saved and available in the history after removing parameters and having strings obfuscated.
If the feature was enabled, and then disabled at some point, important to note is that you are not removing logs, but you are disabling logging. This means that no new entries will be shown, but you will be able to see past entries.