


Query Logs
Query Logs is a feature that we have added on top of Community for monitoring purposes, and essentially it is queries saved in a log. If enabled all queries will get logged without literals and string parameters without affecting performance. Query logs is a crucial tool to analyze the performance statistics of your queries.
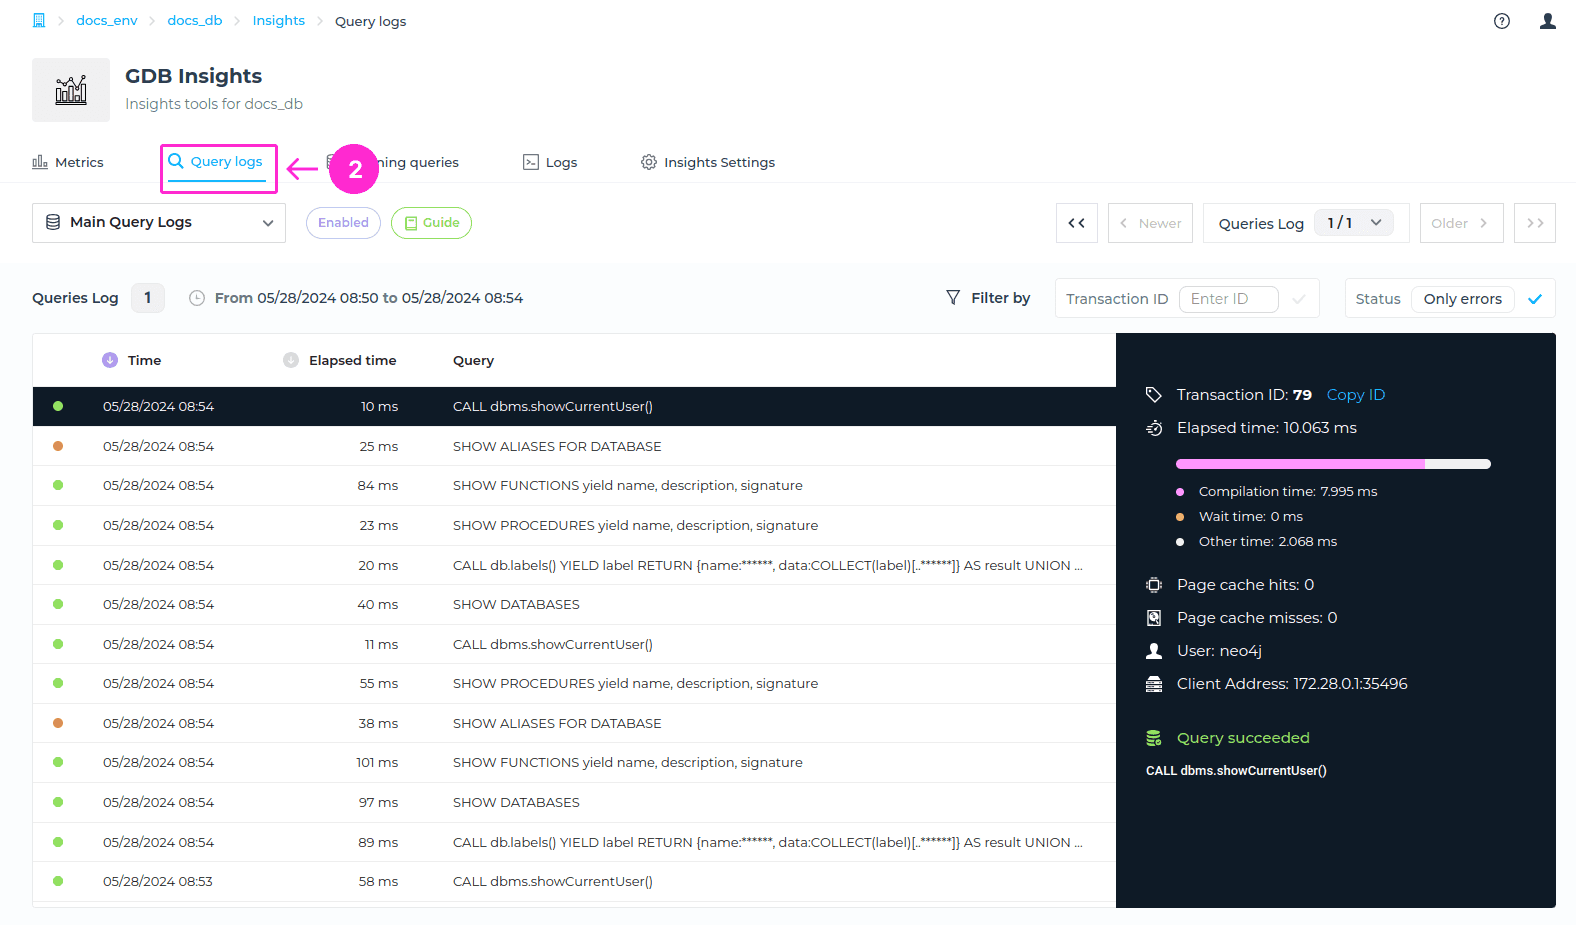
To locate this view, please navigate to the Insights area at the upper right > Query logs tab.
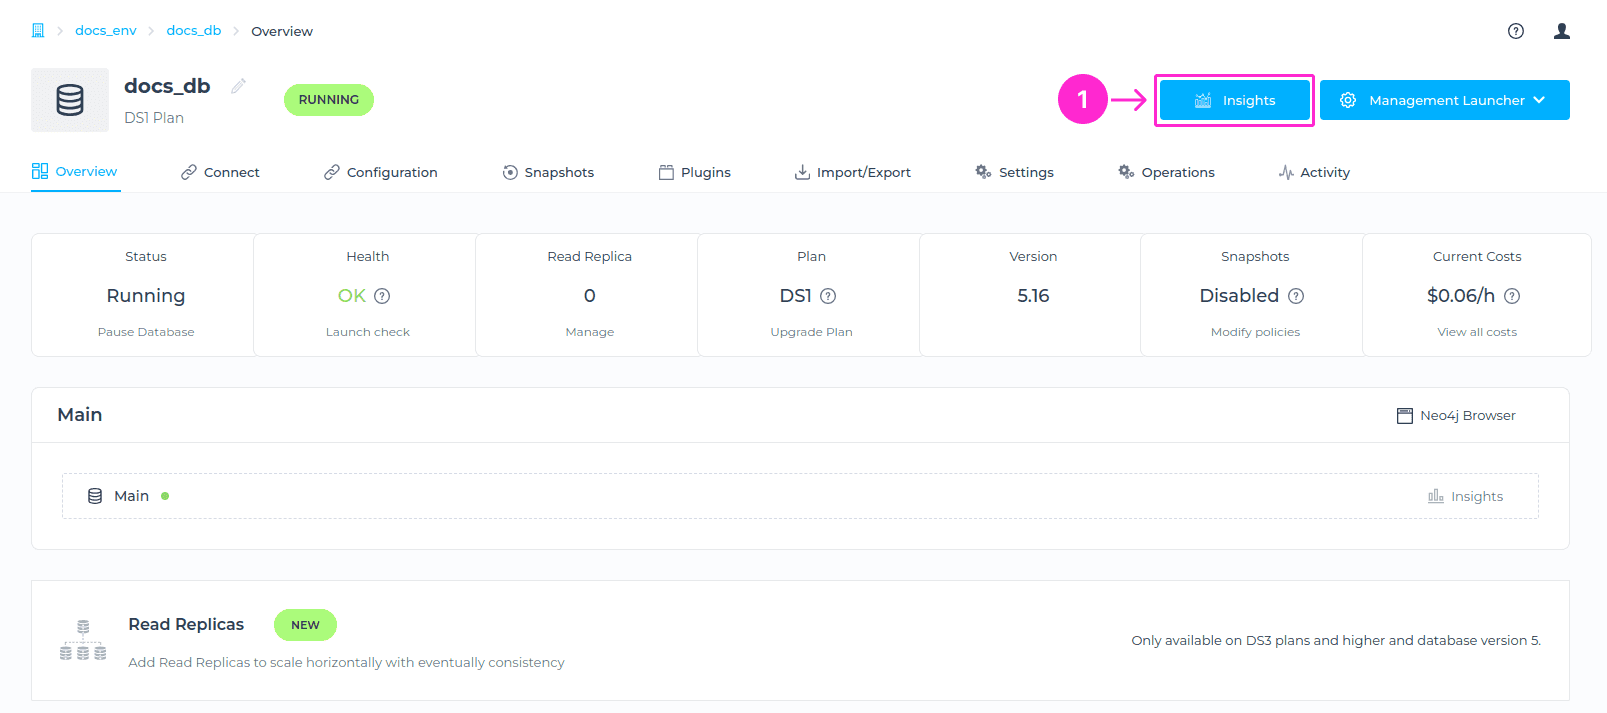
If the database is in a Paused state, query logs are not visible. You will need to Resume your database to see the query log entries.
How to navigate through Query Logs
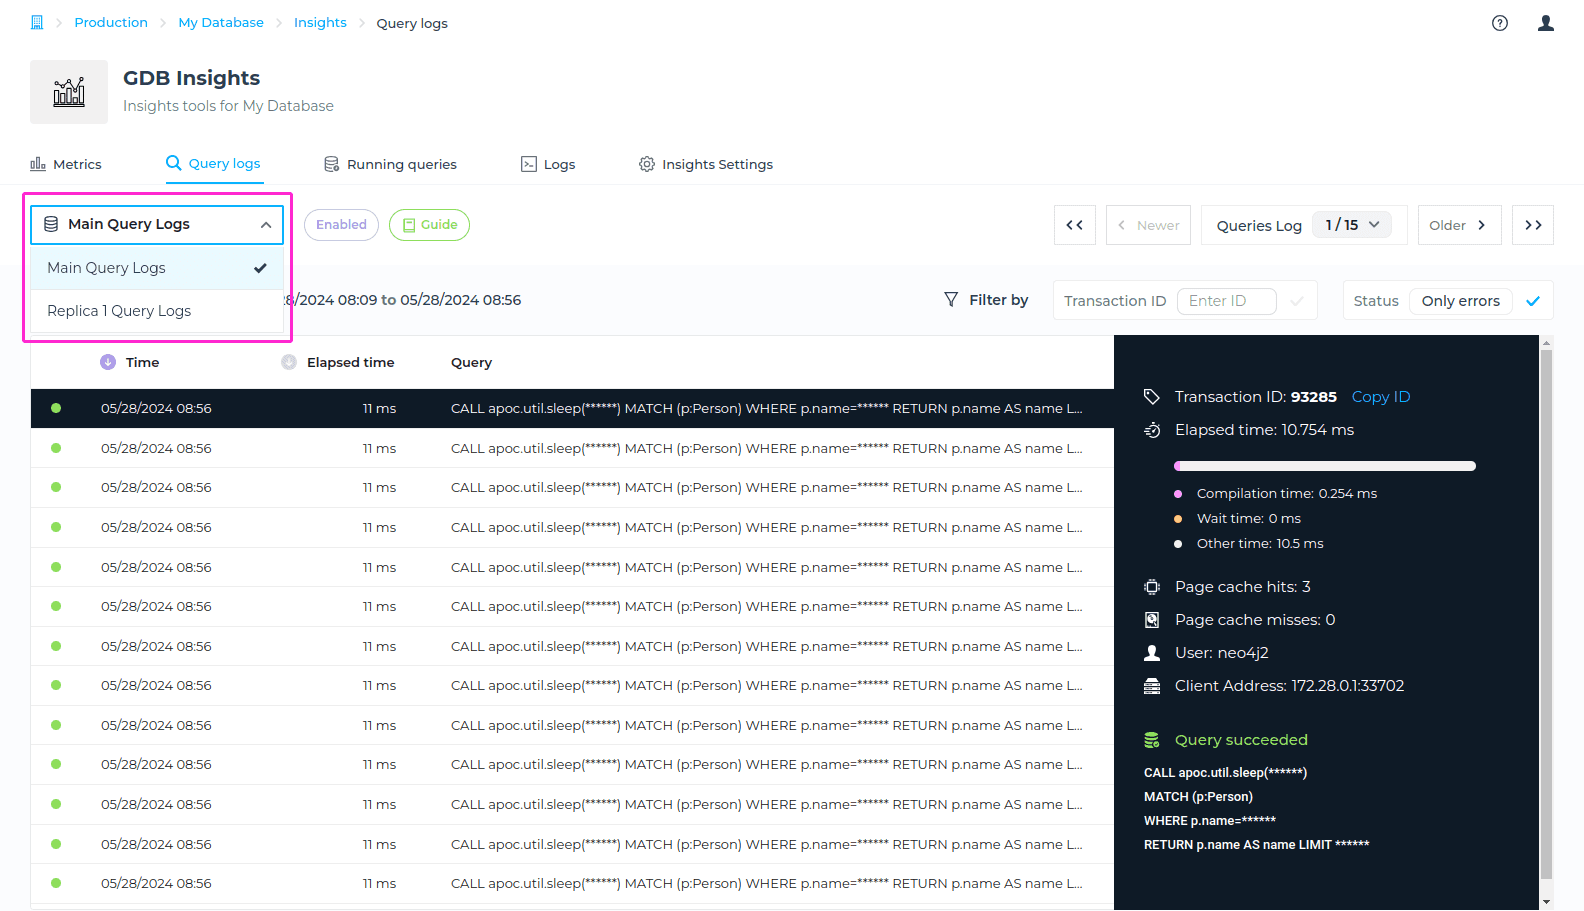
Selecting Node
In a case that you have a Read Replica enabled, you will be able to select for which node you’d like to check Query logs for. You can choose from Main Query logs (The query logs related to main node), or Replica Query logs (The query logs related to Read Replica). To locate this, please navigate to Query Logs tab, and choose a Node from drodown menu.
Logs
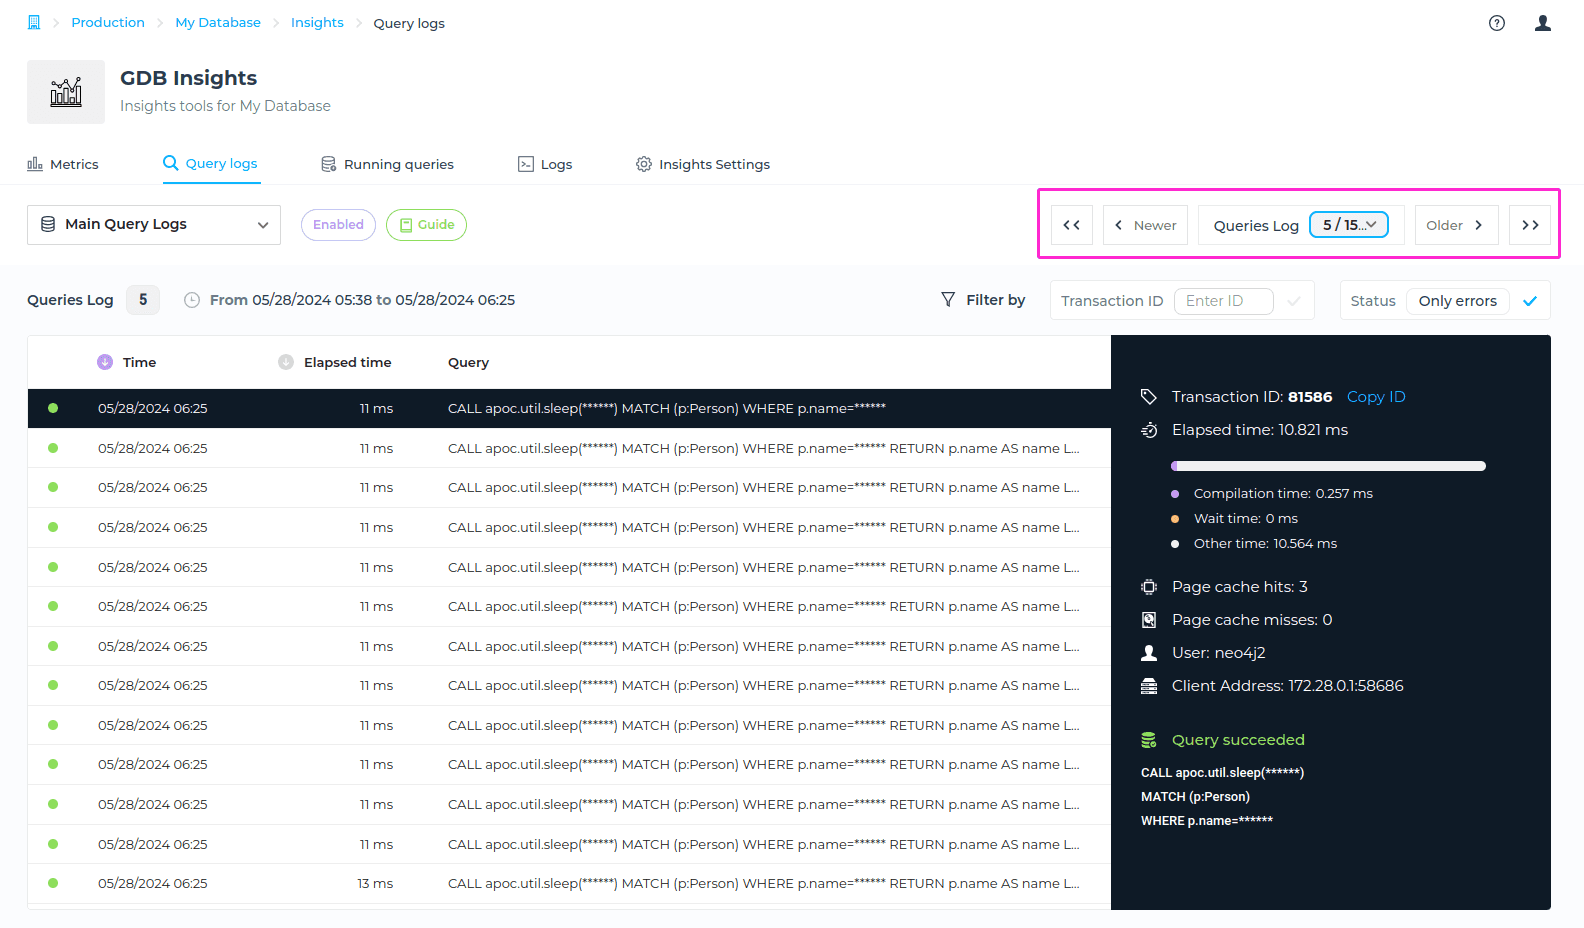
When it comes to Logs you can easily choose which log you want to check. To navigate through these Logs, simply go to the right hand side > Logs > clik on a dropdown menu > choose a Log (for example log 12).
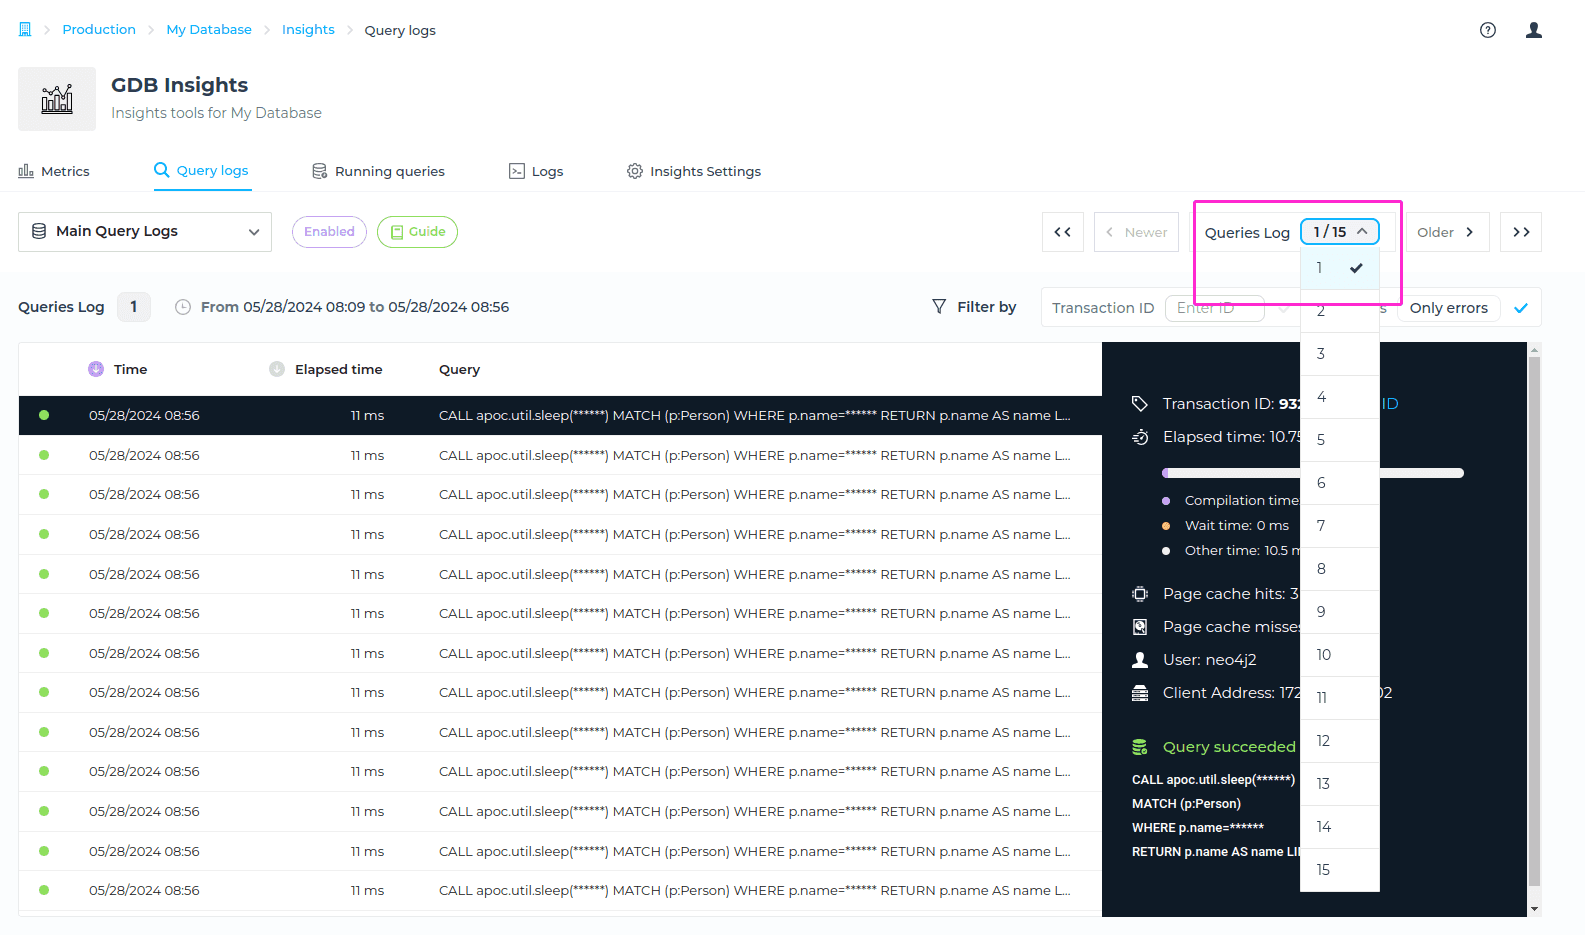
Important to note is the option to Load older logs or Load newer logs. This information can help you navigate to the date and time for which you want to check the Logs for, and gain quicker access to specific query.
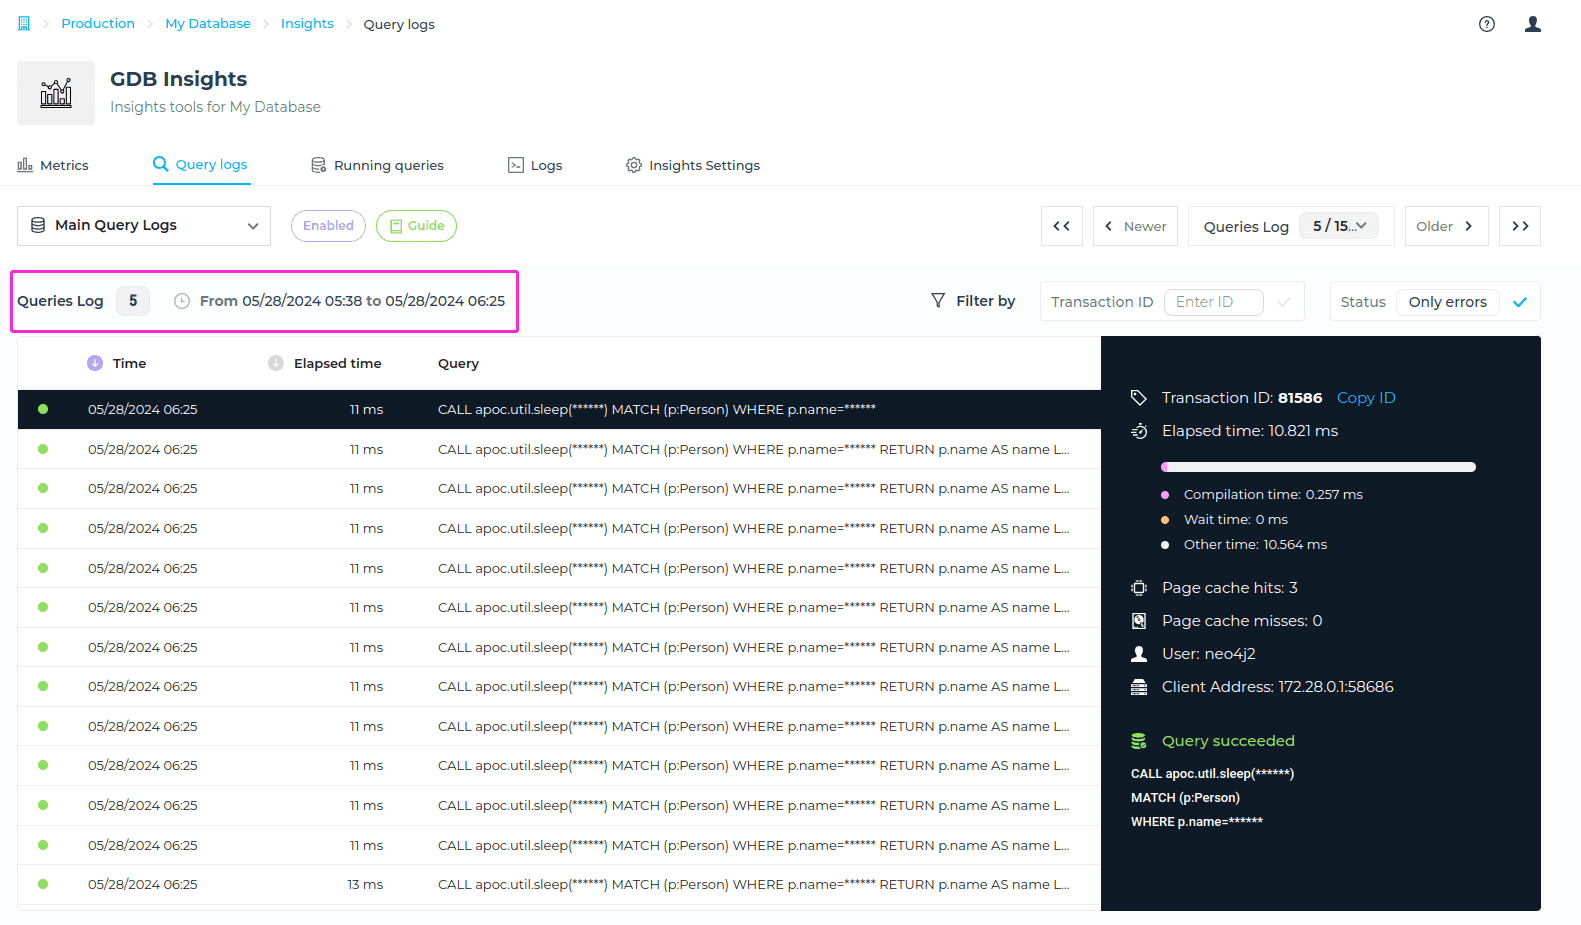
The log selection indicates the specific Log and timeframe. For example, you will see this format: Log 5 From 05/28/2024 05:38 to 05/28/2024 06:25 and this timeframe narrows down the logs to queries that occurred within that date and time. This information is indicated directly above to the listed queries, where you can see Log 5 for example accompanied with timeframe.
How long are query logs saved for?
Query logs are rotated based on size, meaning they will rotate once a specified size limit is reached. The duration of logs available for review depends on the volume of queries written.
For example, if your query volume is low, such as a few queries per month, you might be able to access up to a year’s worth of logs. On the other hand, if your query volume is high, such as 100 queries per second, the available logs may only cover about two days.
Filter and order options within a Log
Filter by transaction ID
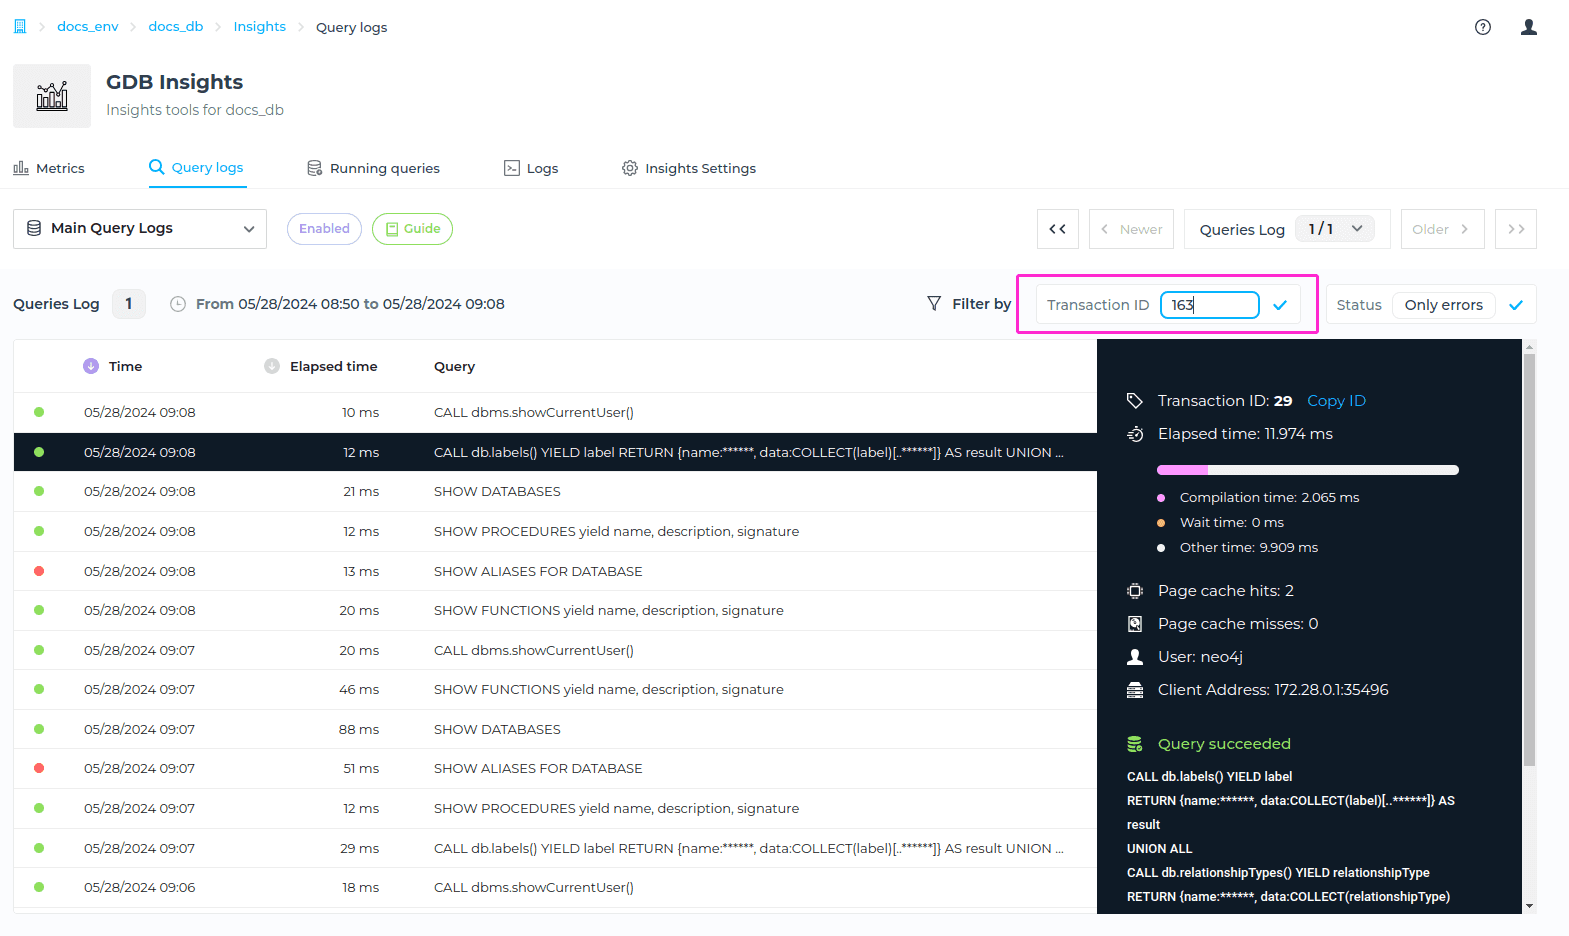
There’s an option for you to filter the desired query info by searching by Transaction ID. Simply enter the transaction ID in respective search box and the query related to that transaction ID will show in the table below, and additional info around that query in the query box on the right.
Filter by Status
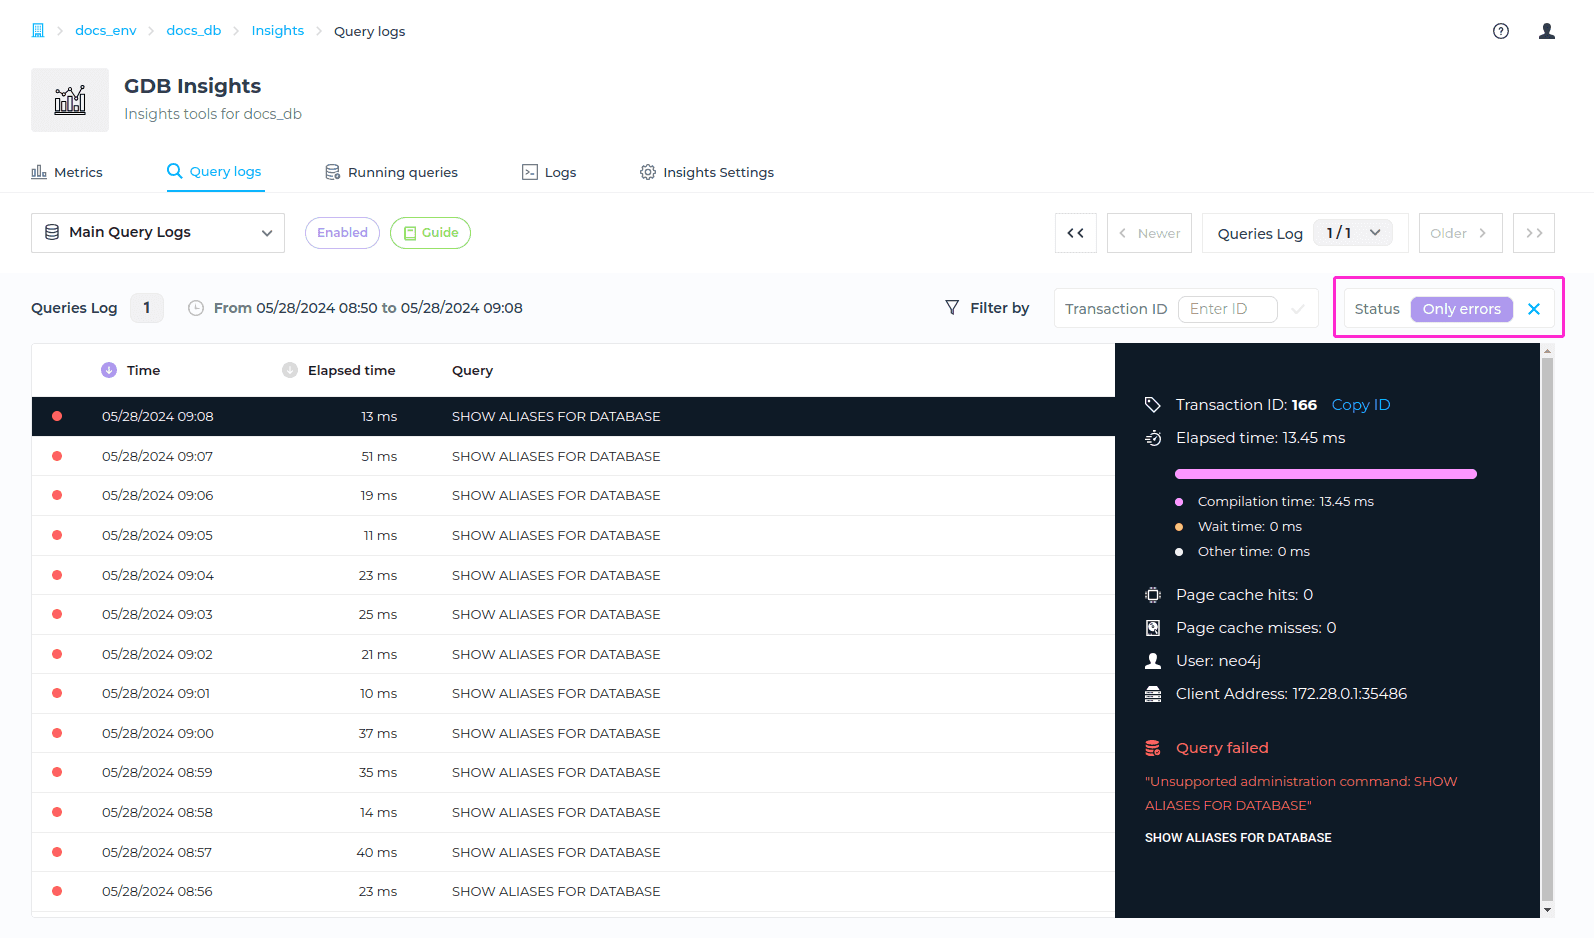
There’s also an option for you to filter the desired query by Status, that being to show those with errors, or no errors. Simply click on the check mark next to No errors field on the right, which will then list you queries with errors only. You can also filter back to the status with no errors by clicking on the cross mark next to the No errors field.
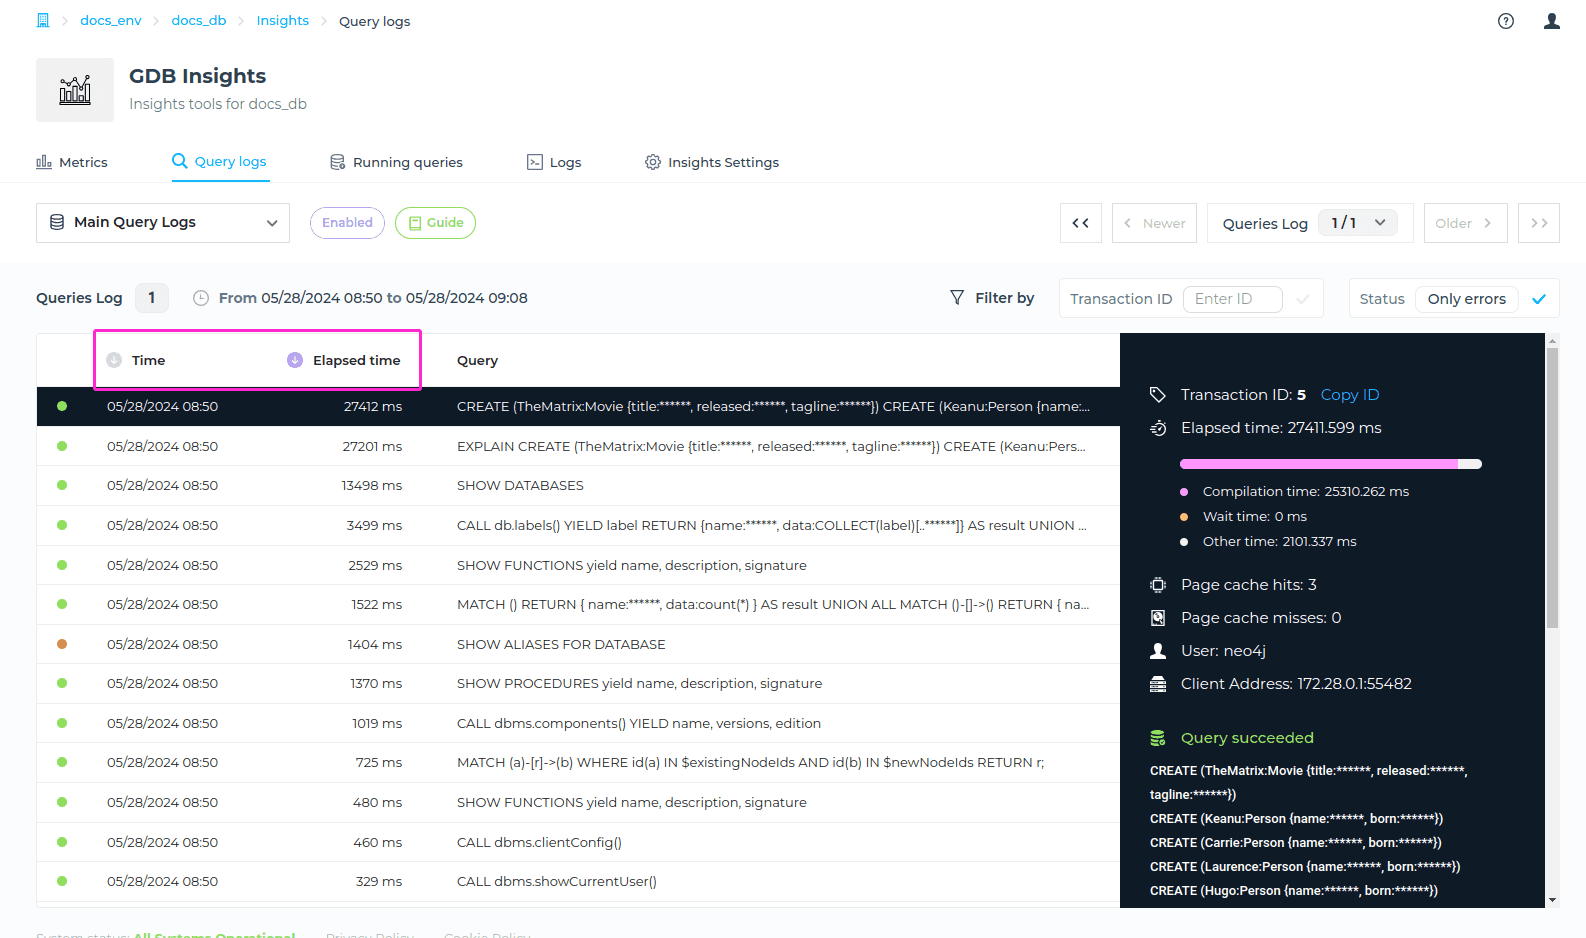
Order by
You can also select by which order you’d like to check the query logs. The options you have are Time and Elapsed time, and you can choose it by simply clicking on respective arrow next to it.
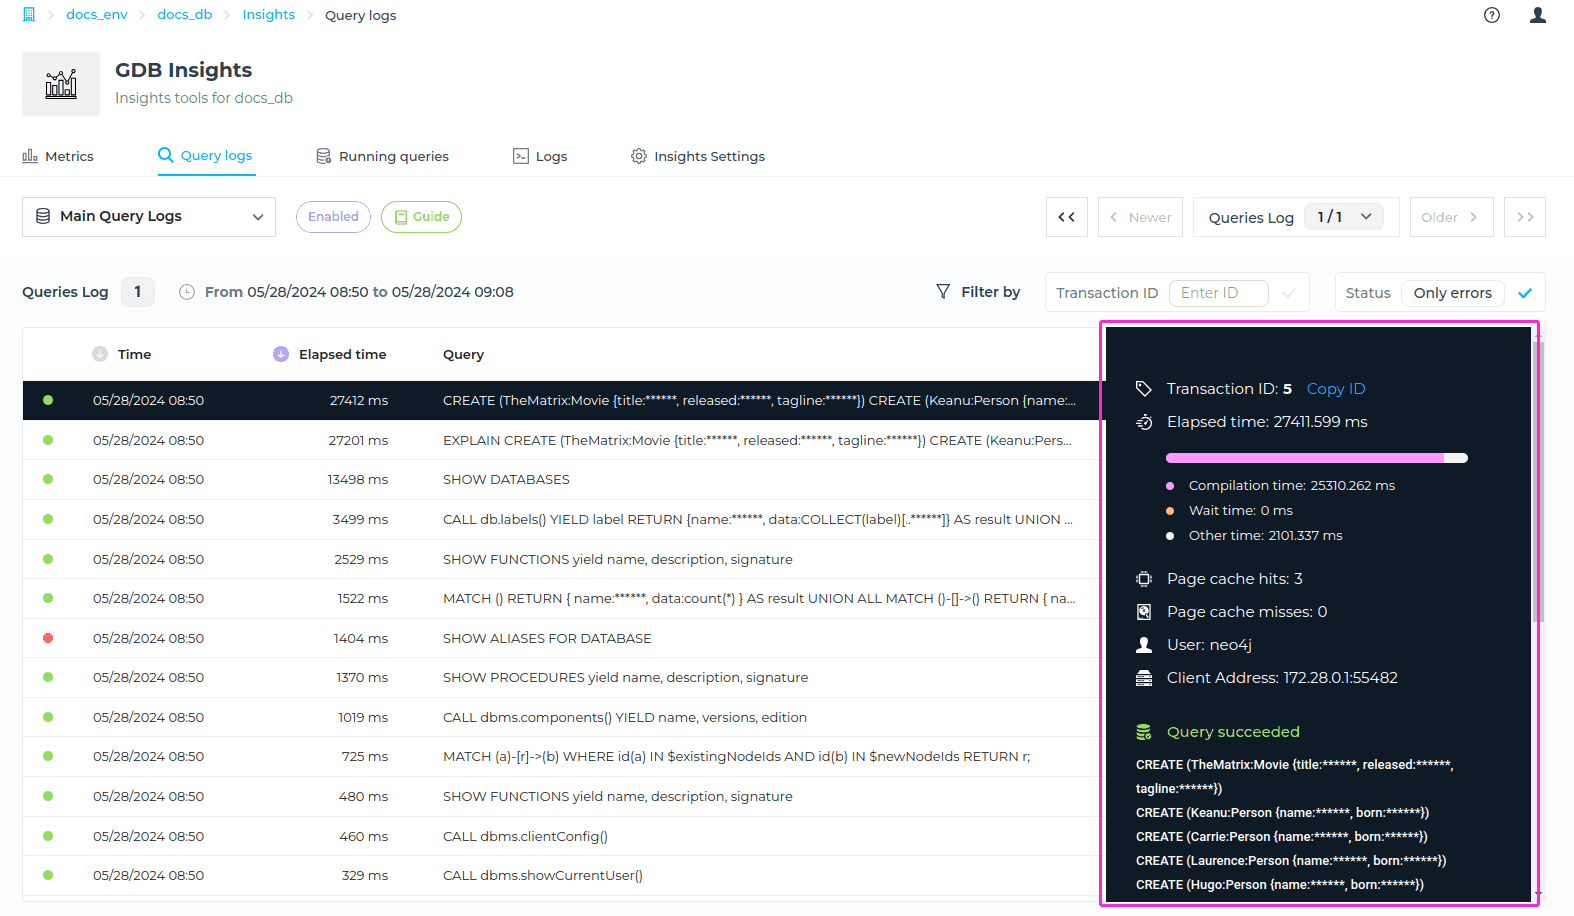
Info available for each query
We are providing various information for each query, and you can find detailed description below.
| Item | Description |
|---|---|
| Time | Provides information about when a particular query was executed. |
| Query | Shows the details of the query |
| Transaction ID | This is a unique identifier for the transaction, allowing you to track and reference the specific transaction in question. |
| Total Time | The total time represents the overall duration taken by the transaction to complete. |
| Compilation Time | This indicates the time spent compiling the query. Compilation time is a subset of the total time and represents the time taken to parse and prepare the query for execution. |
| Wait Time | Wait time refers to the time spent waiting for resources or locks during the transaction. A wait time of 0 milliseconds suggests that the transaction did not encounter any waiting issues. |
| Elapsed Time | Elapsed time represents the actual time taken for query execution excluding the time spent compiling and waiting. It’s calculated as the total time minus the compilation time and wait time. |
| Page Cache Hits | Page cache hits indicate the number of times data pages were found in the cache during query execution. A higher number of page cache hits generally indicates efficient data retrieval, as data is already available in memory. |
| Page Cache Misses | Page cache misses represent the number of times data pages were not found in the cache and had to be fetched from disk. Minimizing page cache misses helps in improving query performance by reducing disk access and utilizing cached data efficiently. |
| User | This identifies the user who initiated the transaction. |
| Client Address | The client address specifies the network address from which the transaction originated. It includes both the IP address and the port number (e.g., 172.28.0.1:50392), providing information about the client’s location and connection details. |
| Query failed | Indicates that the query execution was unsuccessful. |
| Query succeeded | This piece of information is crucial because it confirms that the operation completed as intended and produced the expected results. |
Enable/Disable Query Logging
The Query Logging feature is disabled by default, and you can easily enable it or later disable again without any downtime required. Simply navigate to the Insights Settings tab > Query Logs section > enable or disable query logging.
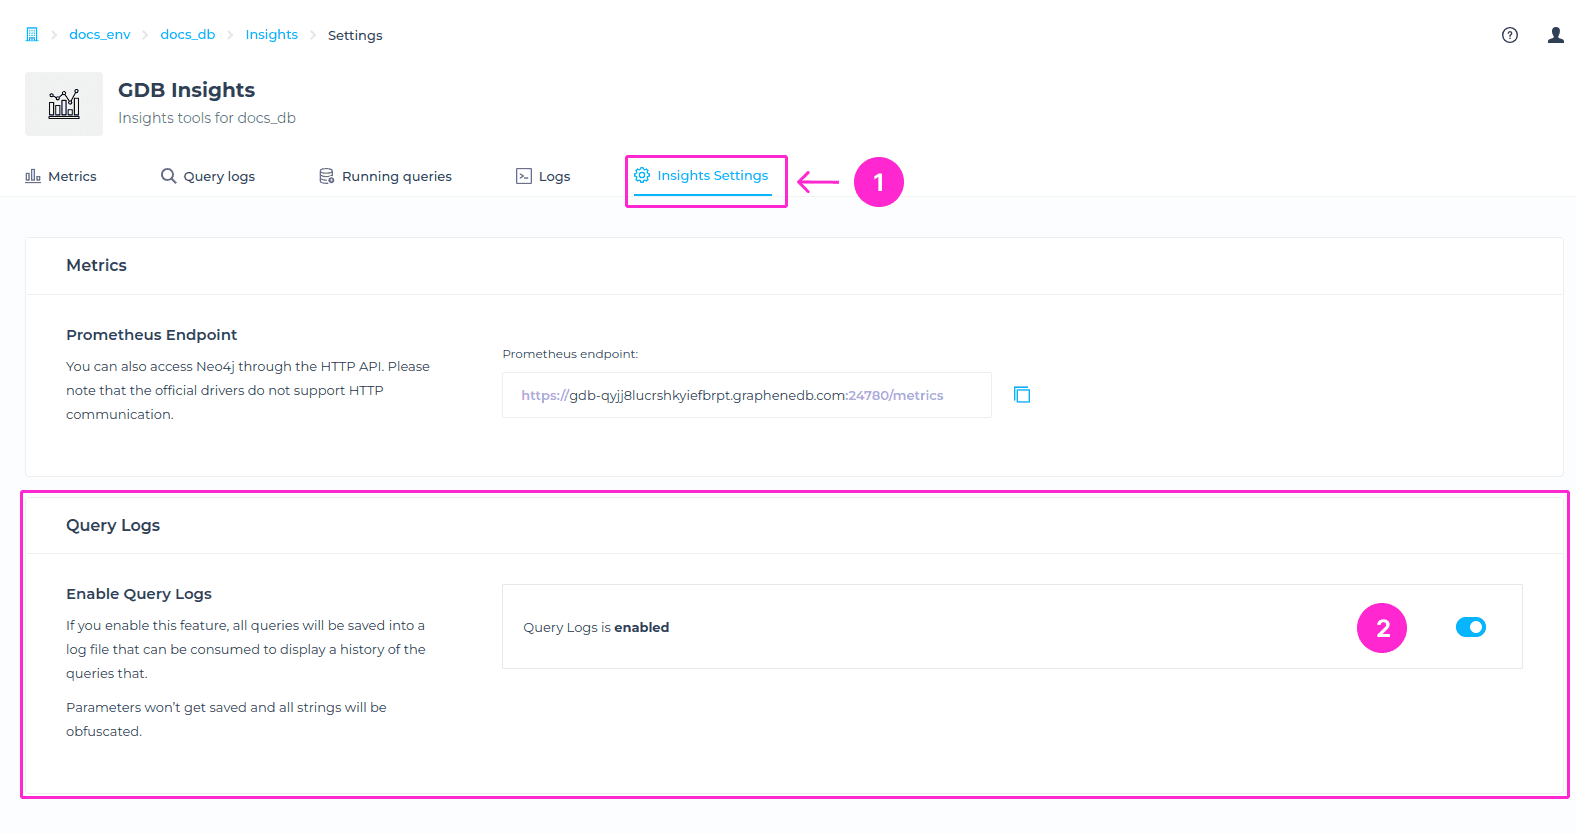
If you enable this feature, all queries will be saved and available in the history after removing parameters and having strings obfuscated.
If the feature was enabled, and then disabled at some point, important to note is that you are not removing logs, but you are disabling logging. This means that no new entries will be shown, but you will be able to see past entries.