Metrics Overview
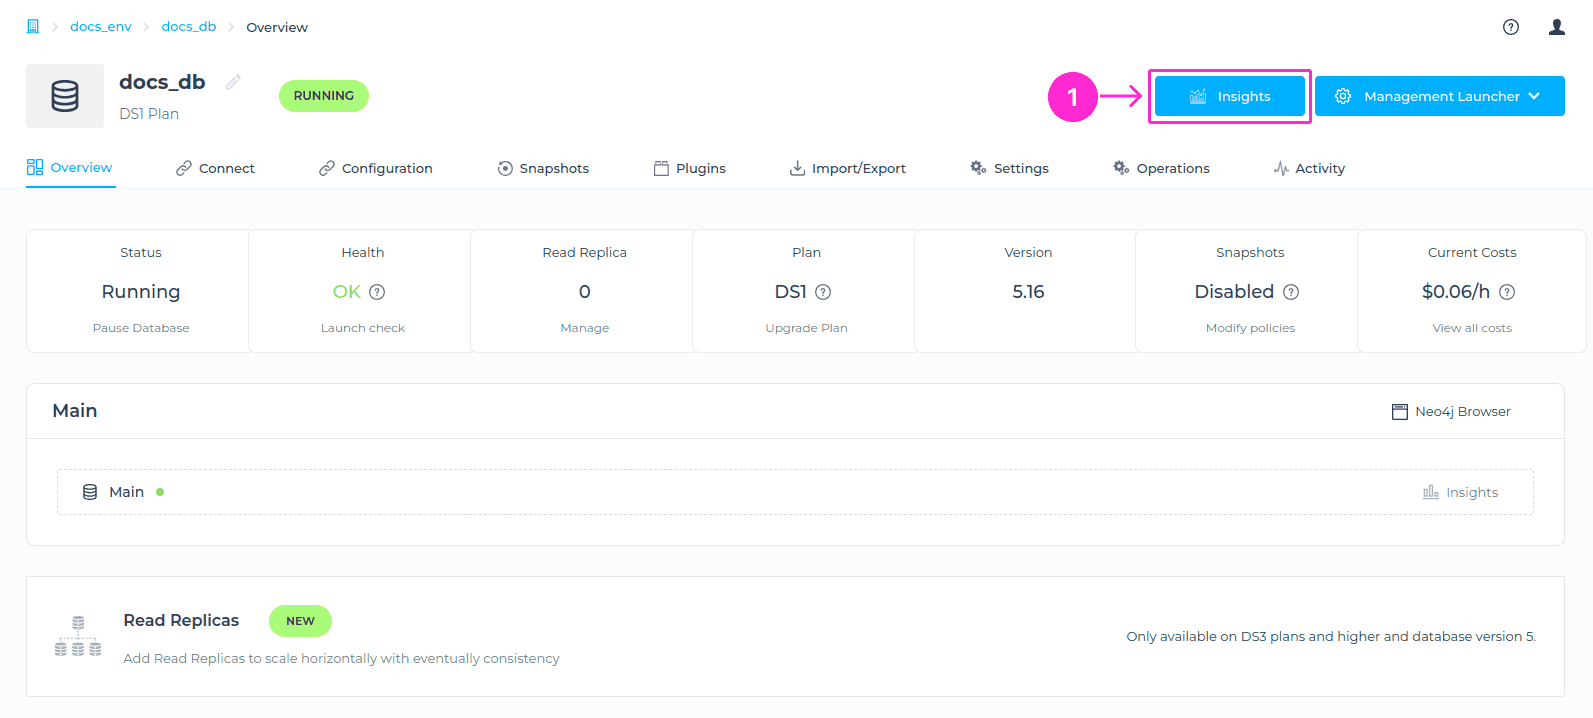
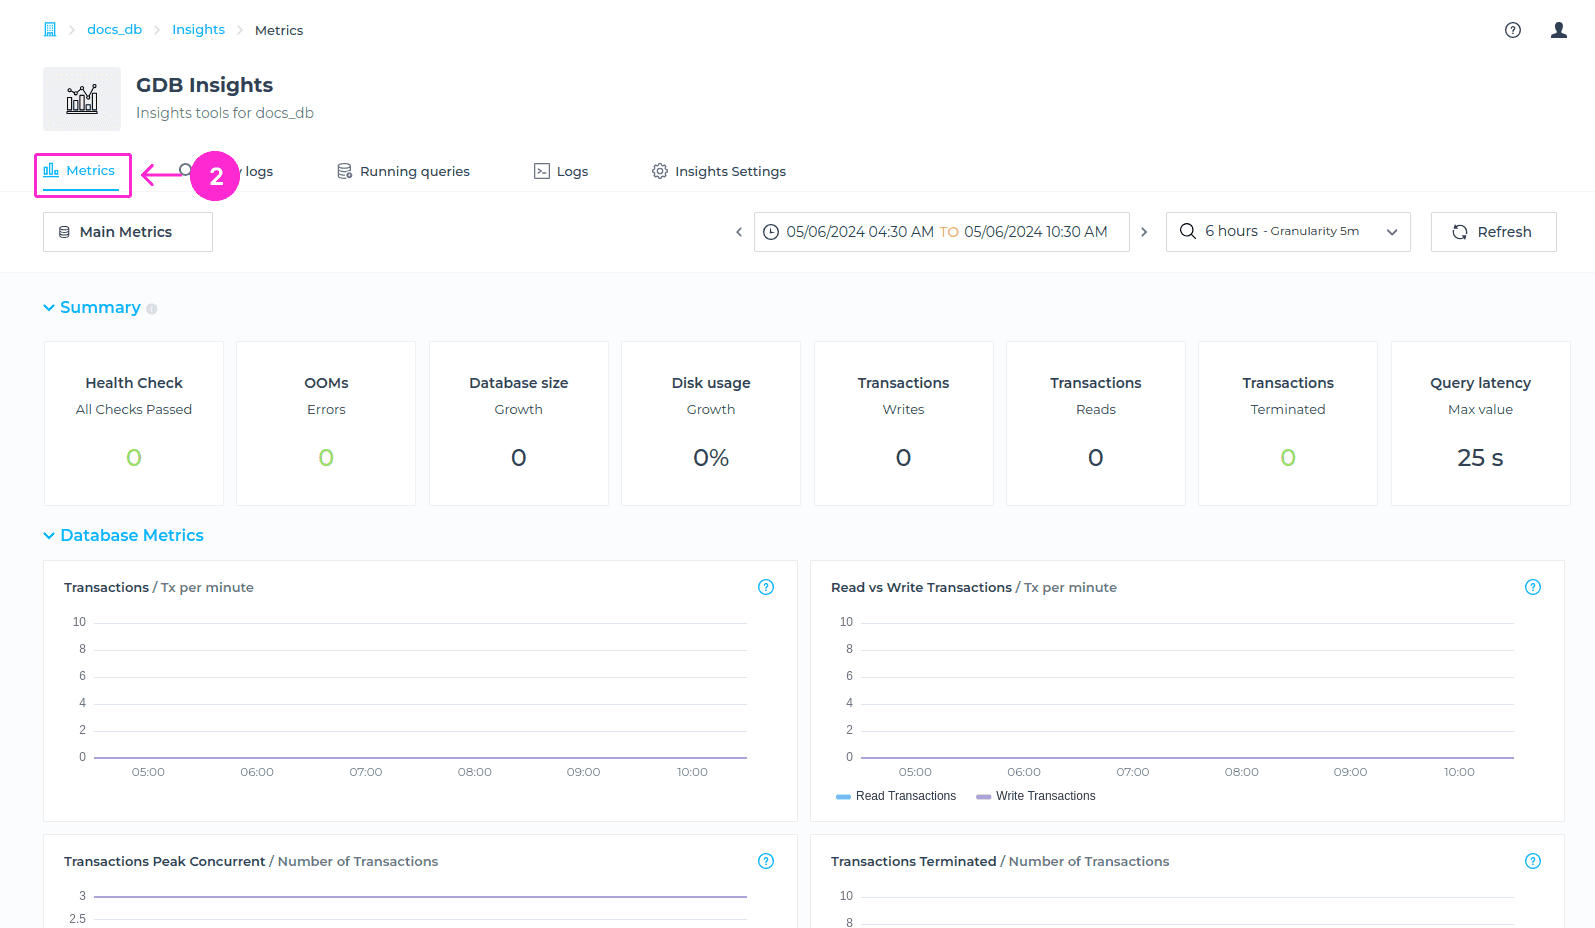
GrapheneDB provides you with a Metrics tool that allows you to have great visibility into your database state and overall metrics. To locate this view, please navigate to the Insights area at the upper right > Metrics tab.
The following metrics are available to you within the Metrics tab:
- Summary - Aggregation of key metrics over the selected time window. Interesting for a quick overview and detecting trends.
- Database metrics - Metrics related to the database, like transactions, query latency etc.
- Server metrics - Metrics related to the server where the database is running, such as CPU, RAM, disk, etc.
- Health metrics - Size and health metrics
- Replication metrics - Metrics related to the Read Replicas in case you have added them to your deployment.
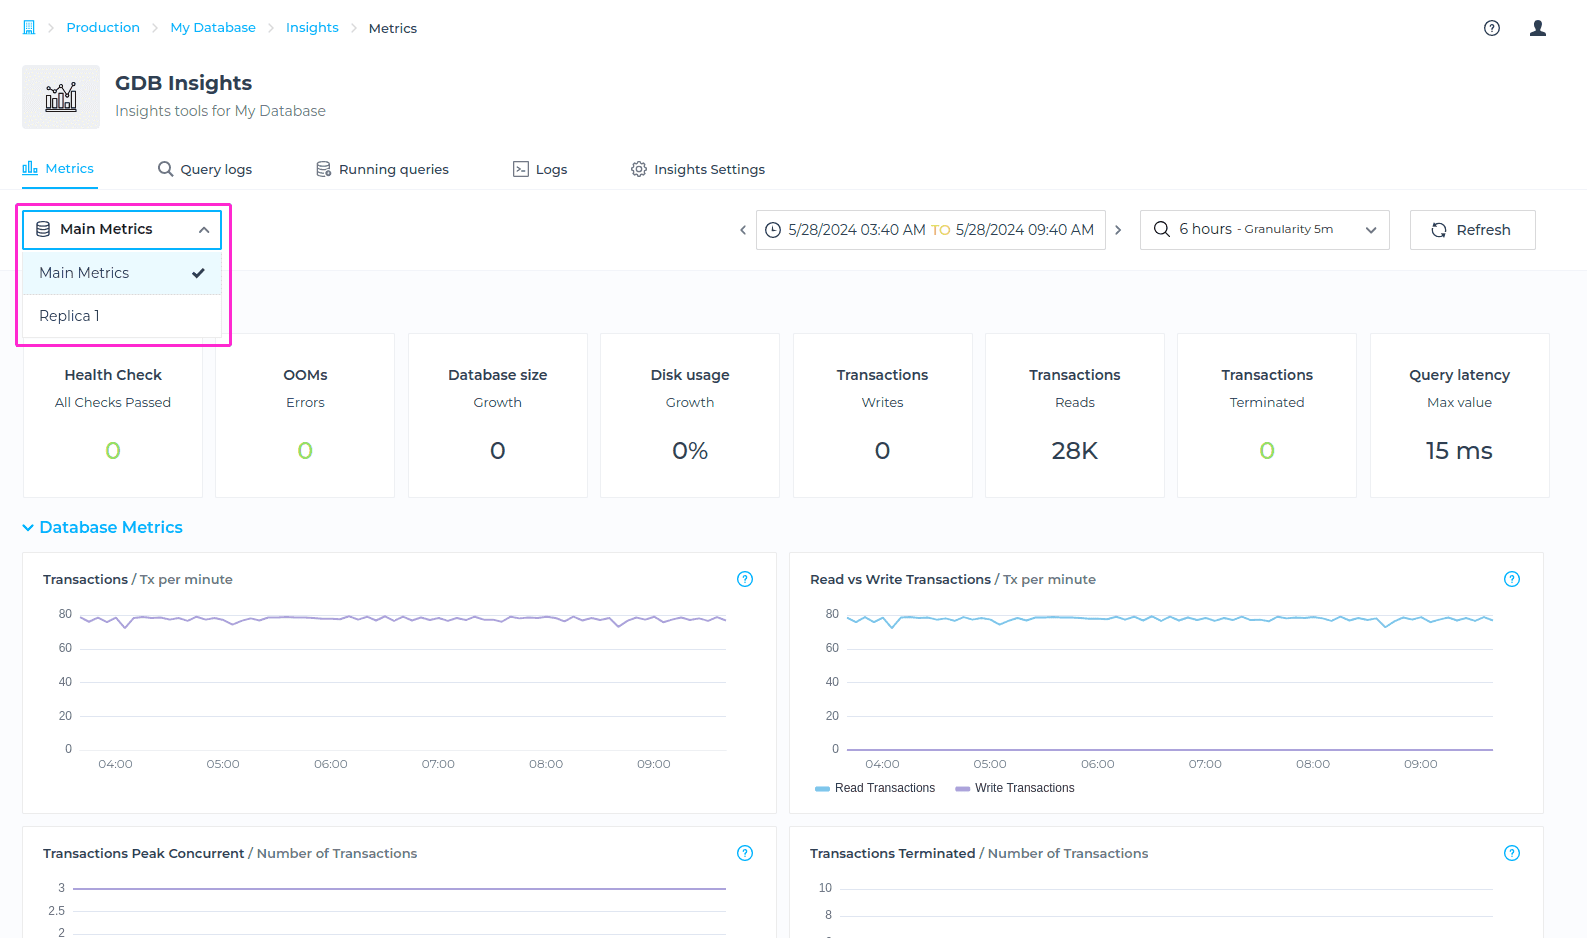
Selecting Node and Time Window
Selecting Node Metrics
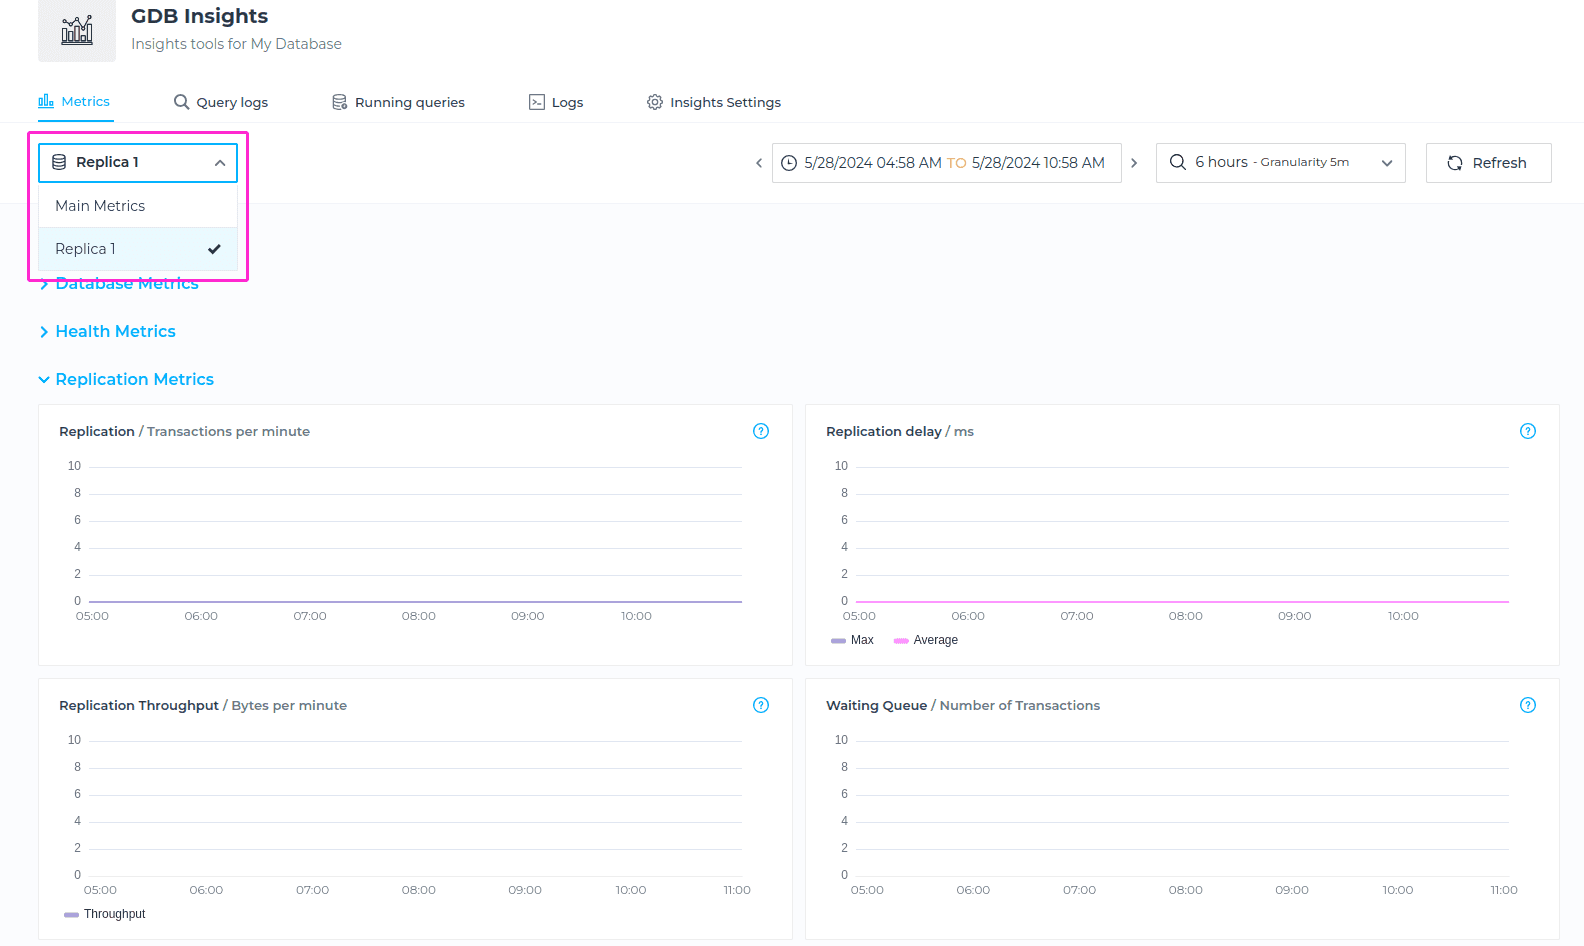
In a case that you have a Read Replica enabled, you will be able to select for which node you’d like to check the Metrics for. You can choose from Main Metrics (The metrics related to main node), or Replica 1 for example (The metrics related to Read Replica). To locate this, please navigate to Metrics tab, and choose a Node from drodown menu.
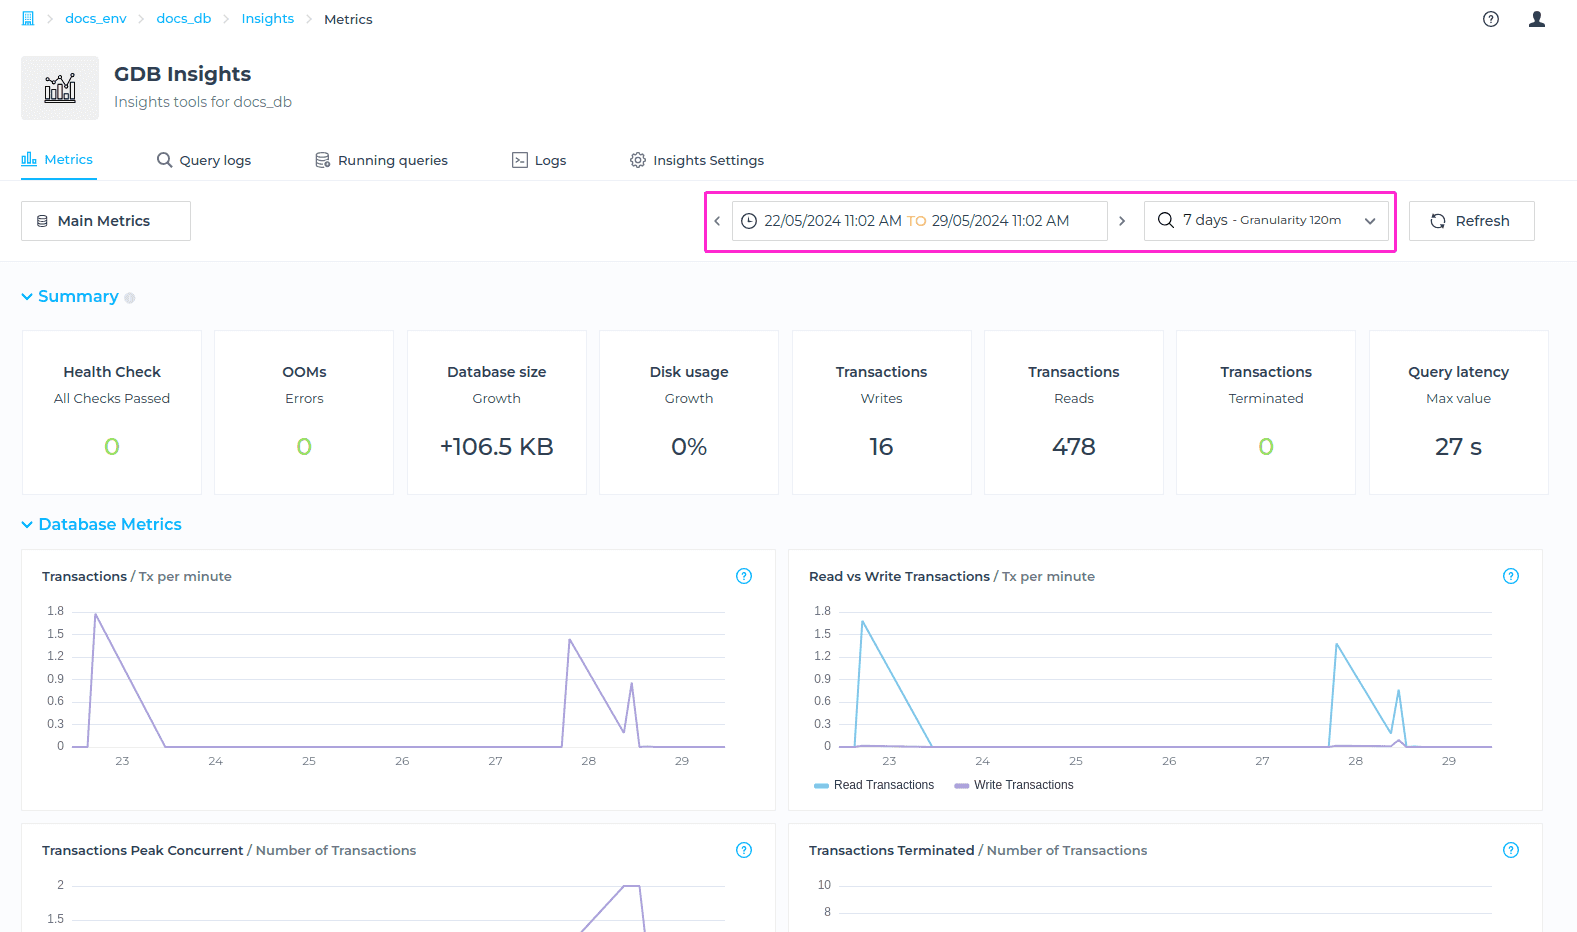
Time Windows
To choose a specific period to be displayed on the charts, you can use a drop-down menu on the right-hand side, to select it. Options for the periods to choose from are:
- 6 hours - Granularity 5 min
- 24 hours - Granularity 20 min
- 7 days - Granularity 120 min
Important to note is the Granularity because every time window comes with different granularity. Granularity is the distance in time between points in the graph. For example in the time window of 6 hours there are points every 5 min, thus it will be easier to detect peaks, whereas in the 7 days time window chart will be more flat and there are more chances that peaks go undetected.
Once the desired option is selected, you have additional option to move the interval to the past or present, by clicking on the left or right arrow and get insights into historic metrics, or switch back to most recent ones.
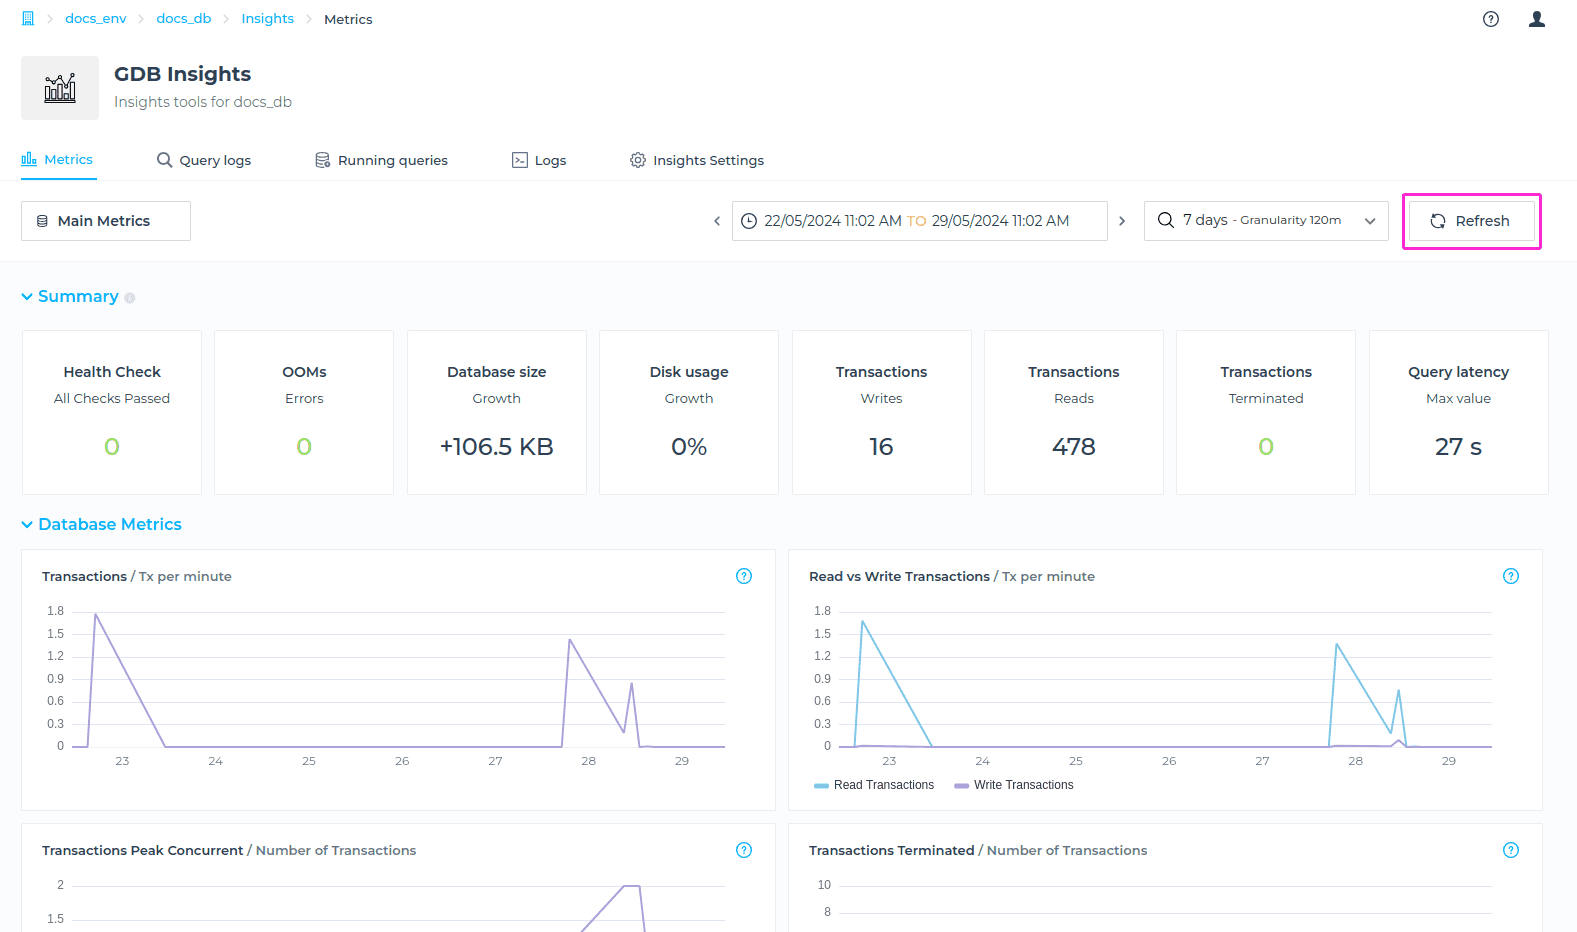
You can also always refresh the status to get the most recent data. Simply click on Refresh button on the right hand side.
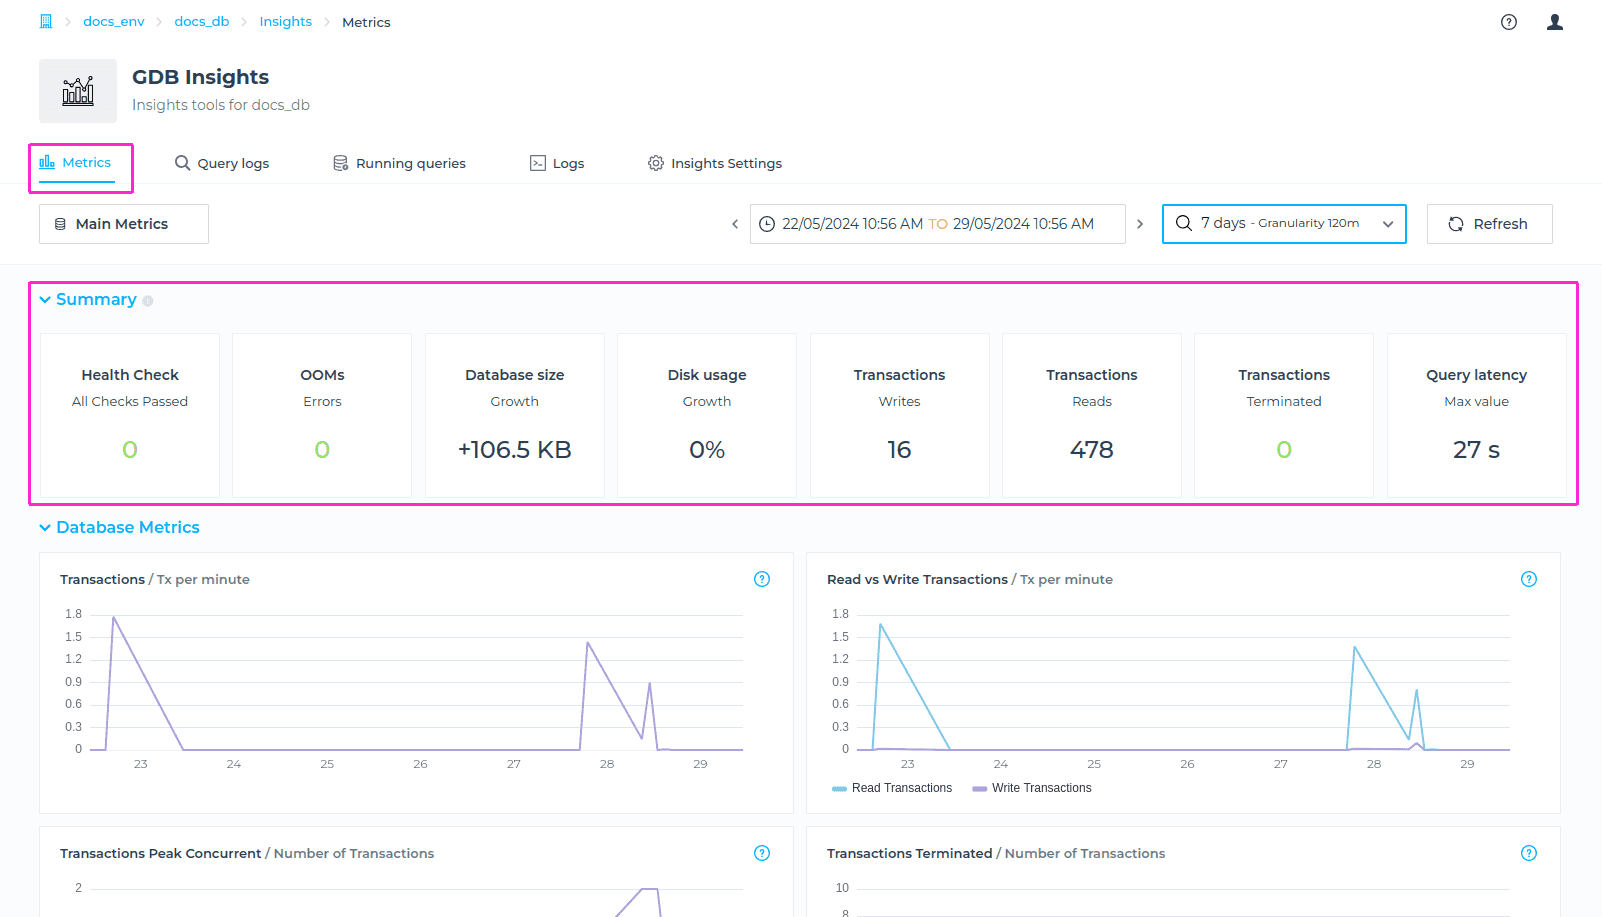
Summary
This summary gives you a aggregation of certain key metrics over the selected Time Window. In the Summary section of the Metrics tab, you can find the following general information:
- Health Check
- OOM errors
- Database size growth
- Disk usage growth
- Reads vs Writes
- Terminated transactions
- Query latency
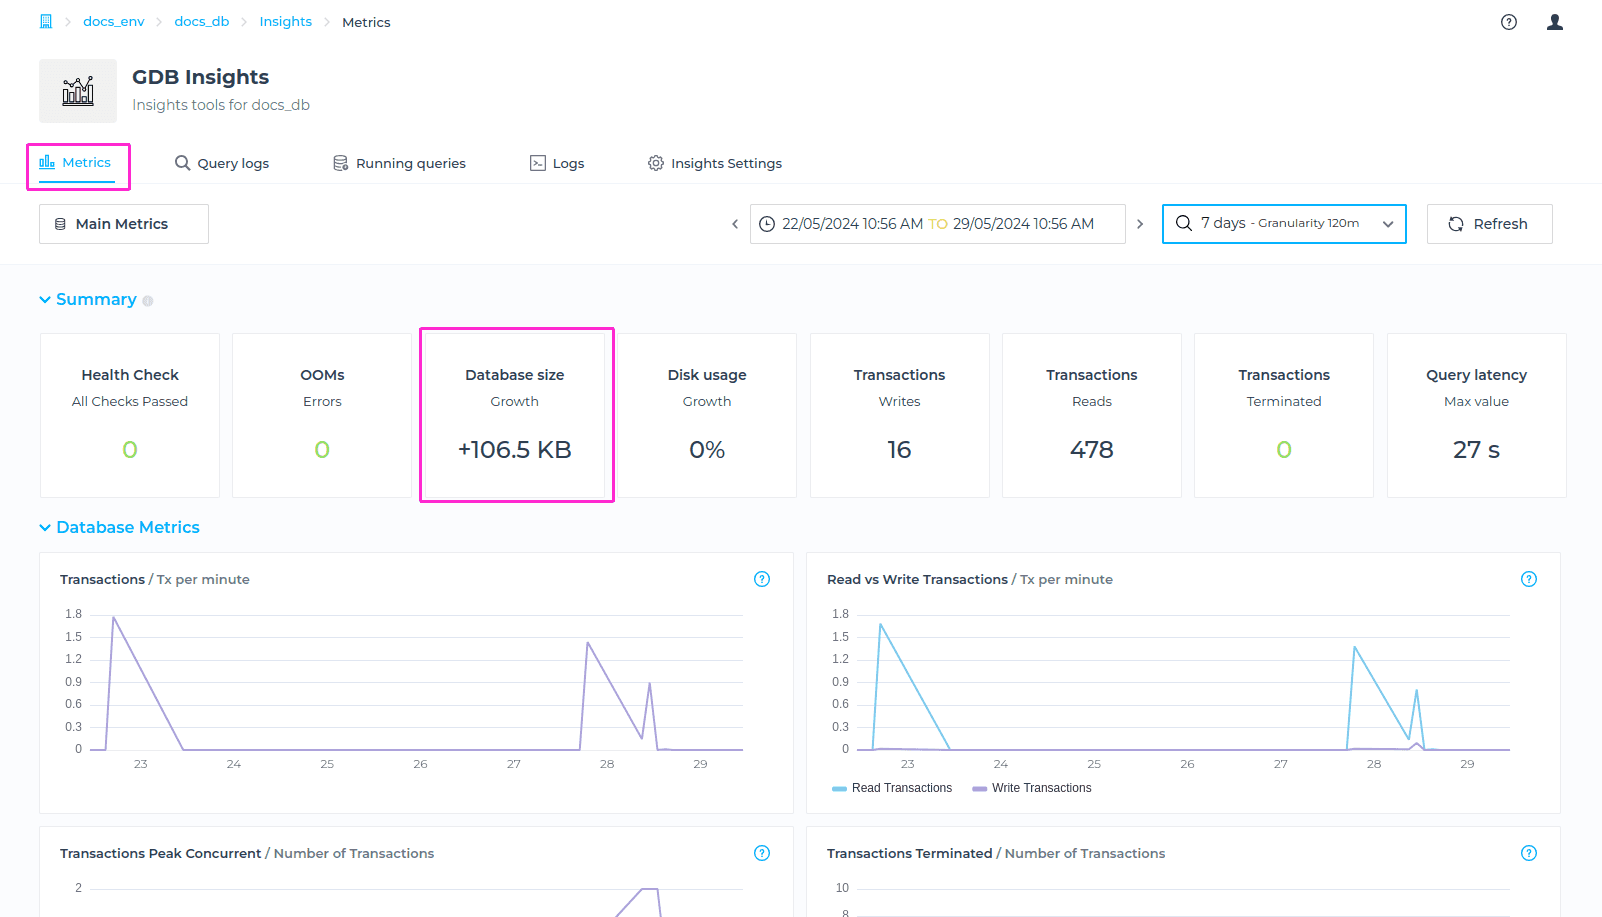
Database Size Growth
A metric for Database Size Growth - in Bytes shows the cumulative increase in the size of a database over the selected timeframe, measured in bytes.
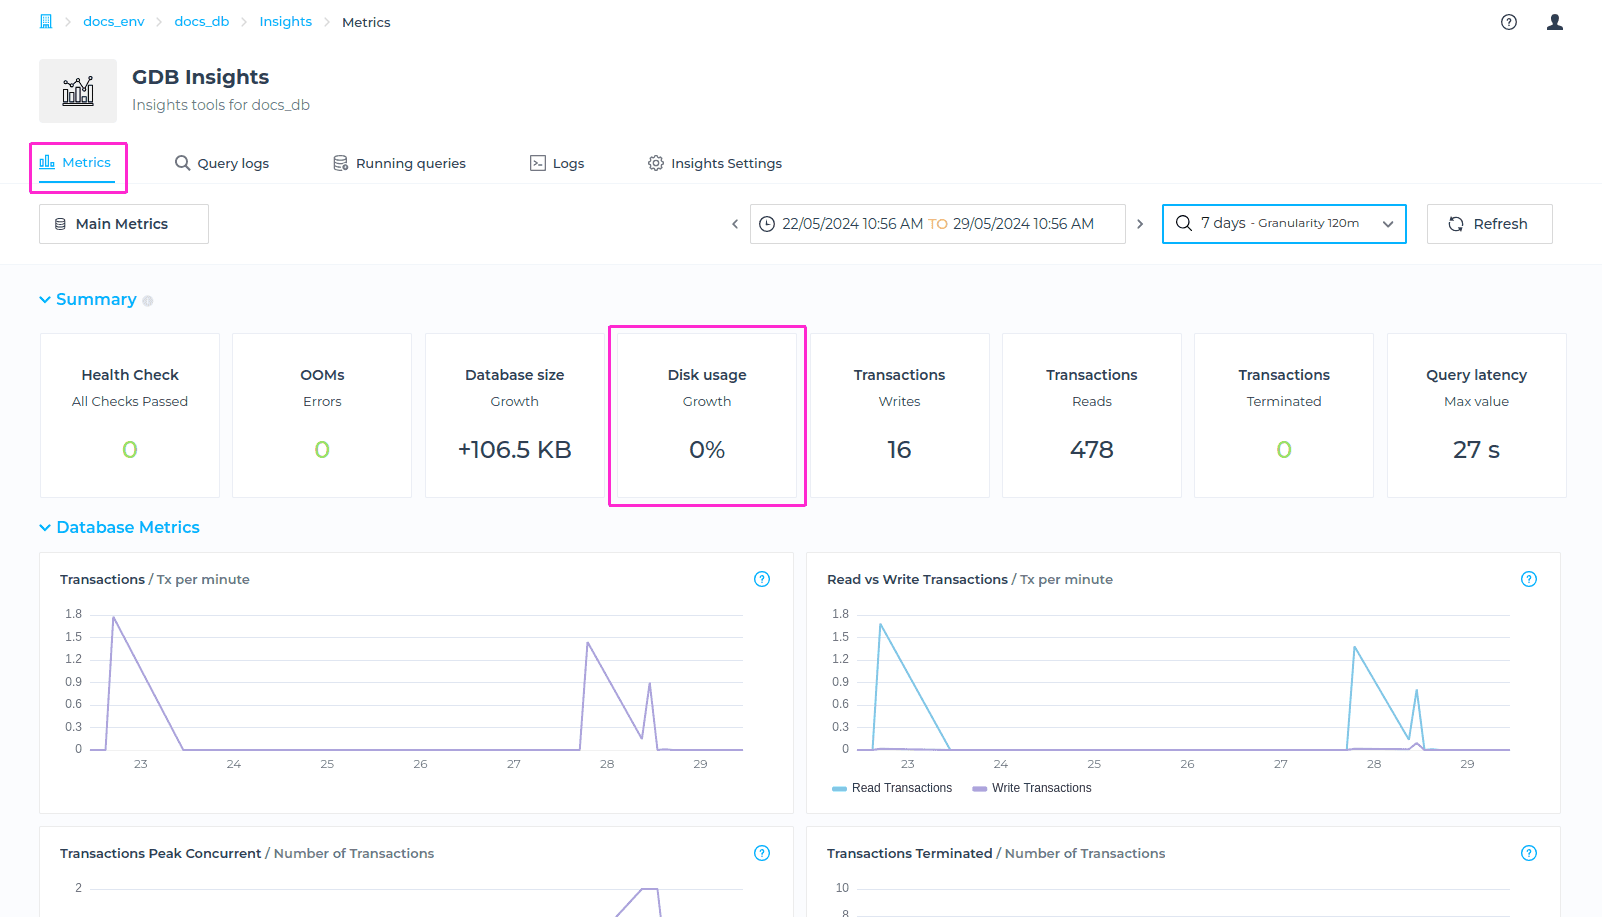
Disk Usage Growth
The metric Disk Usage Growth refers to the increase in disk space consumed by a database over the selected time frame.
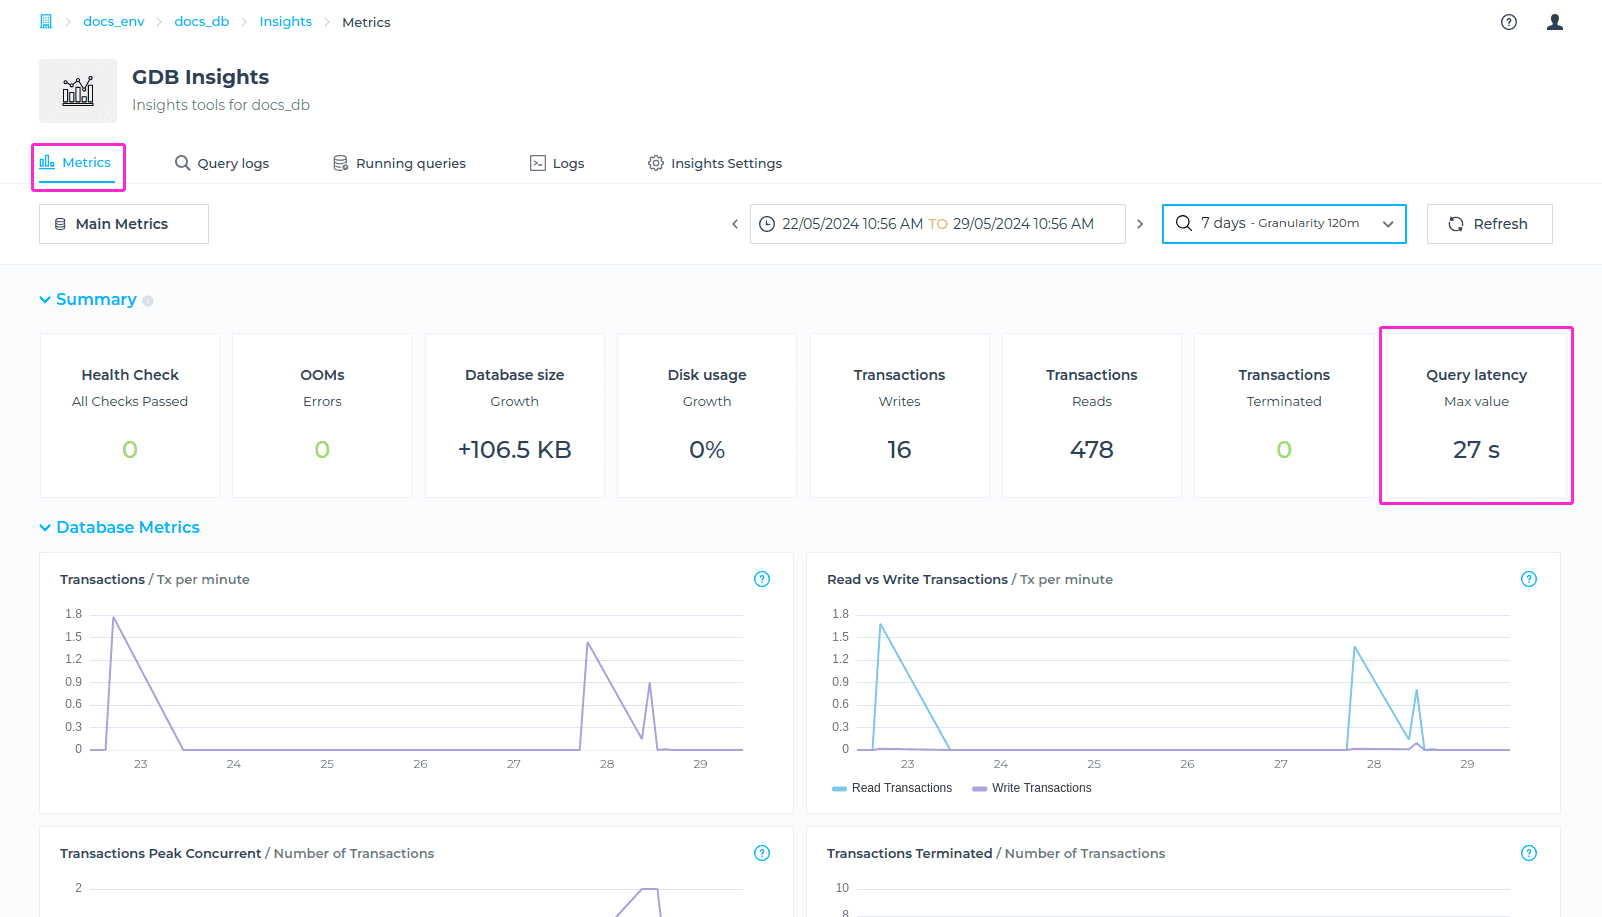
Query Latency
The metric Query Latency - Max value (ms) indicates the maximum amount of time taken for a query to be processed and return results, for the selected timeframe, and it’s measured in milliseconds.
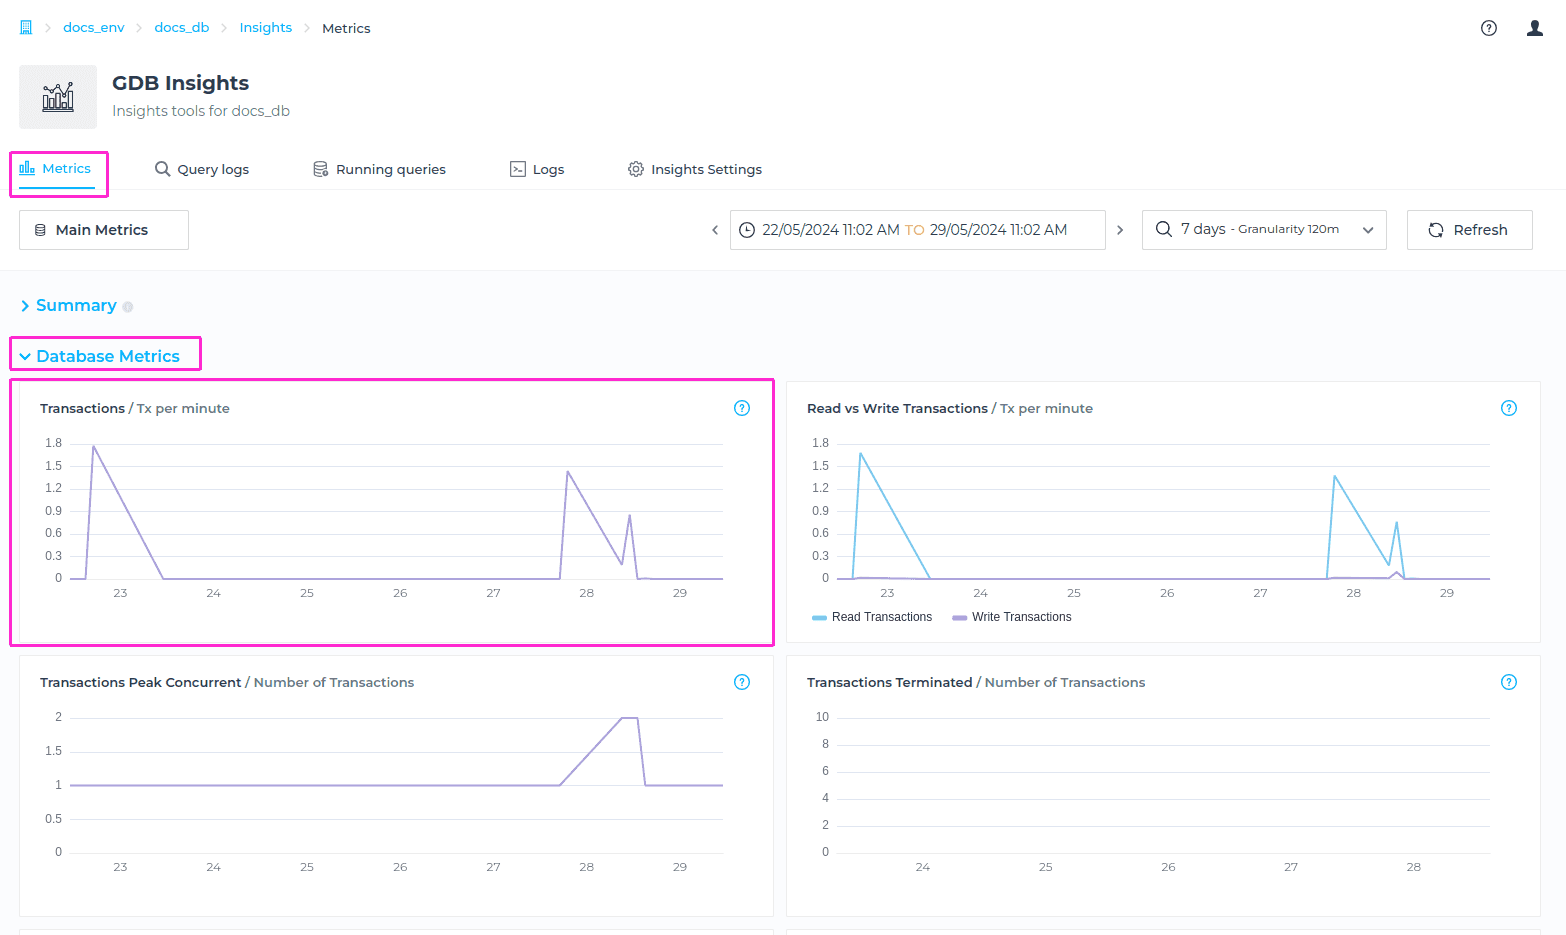
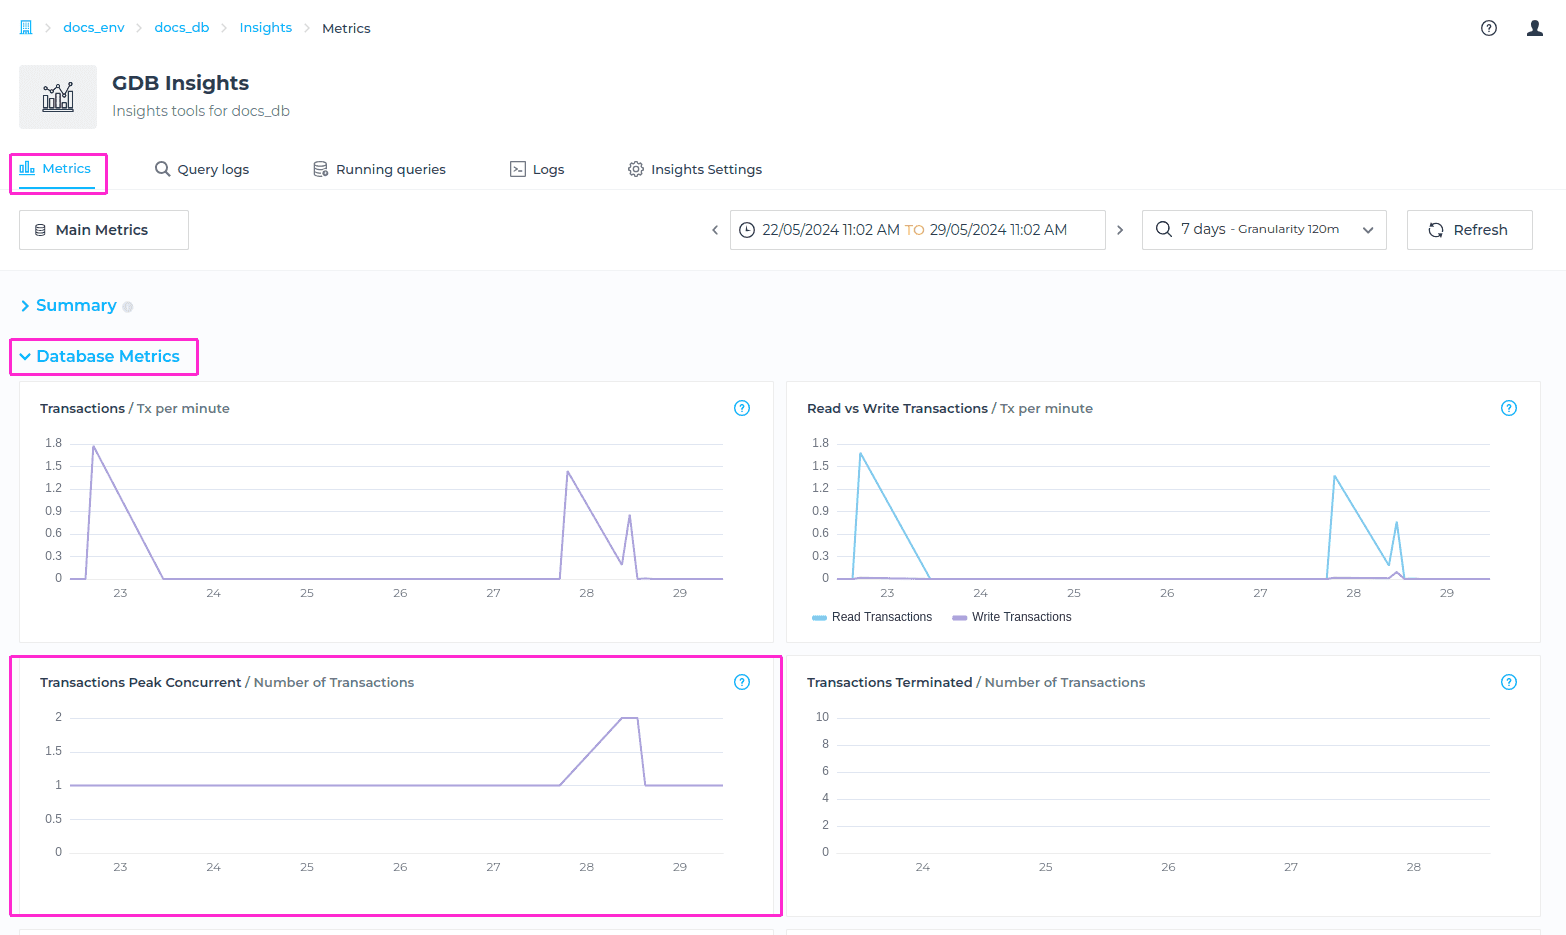
Database Metrics
The Database Metrics section provides comprehensive visibility and insights into transactional activity, query execution state, Bolt connections behavior and more. In the Database Metrics section of the Metrics tab you can find the following information:
- Transactions
- Read vs Write Transactions
- Highest peak of concurrent transactions
- Number of terminated transactions
- Queries per minute of successfully executed queries
- Number of failed queries executed
- Normalized distribution of query execution times
- Number of Bolt connections
- Running bolt connections
- Bolt messages
- Number of messages of failed bolt messages
Transactions
Transactions metric refers to the amount of data processed or transferred during database transactions over a one-minute time interval, for the selected timeframe.
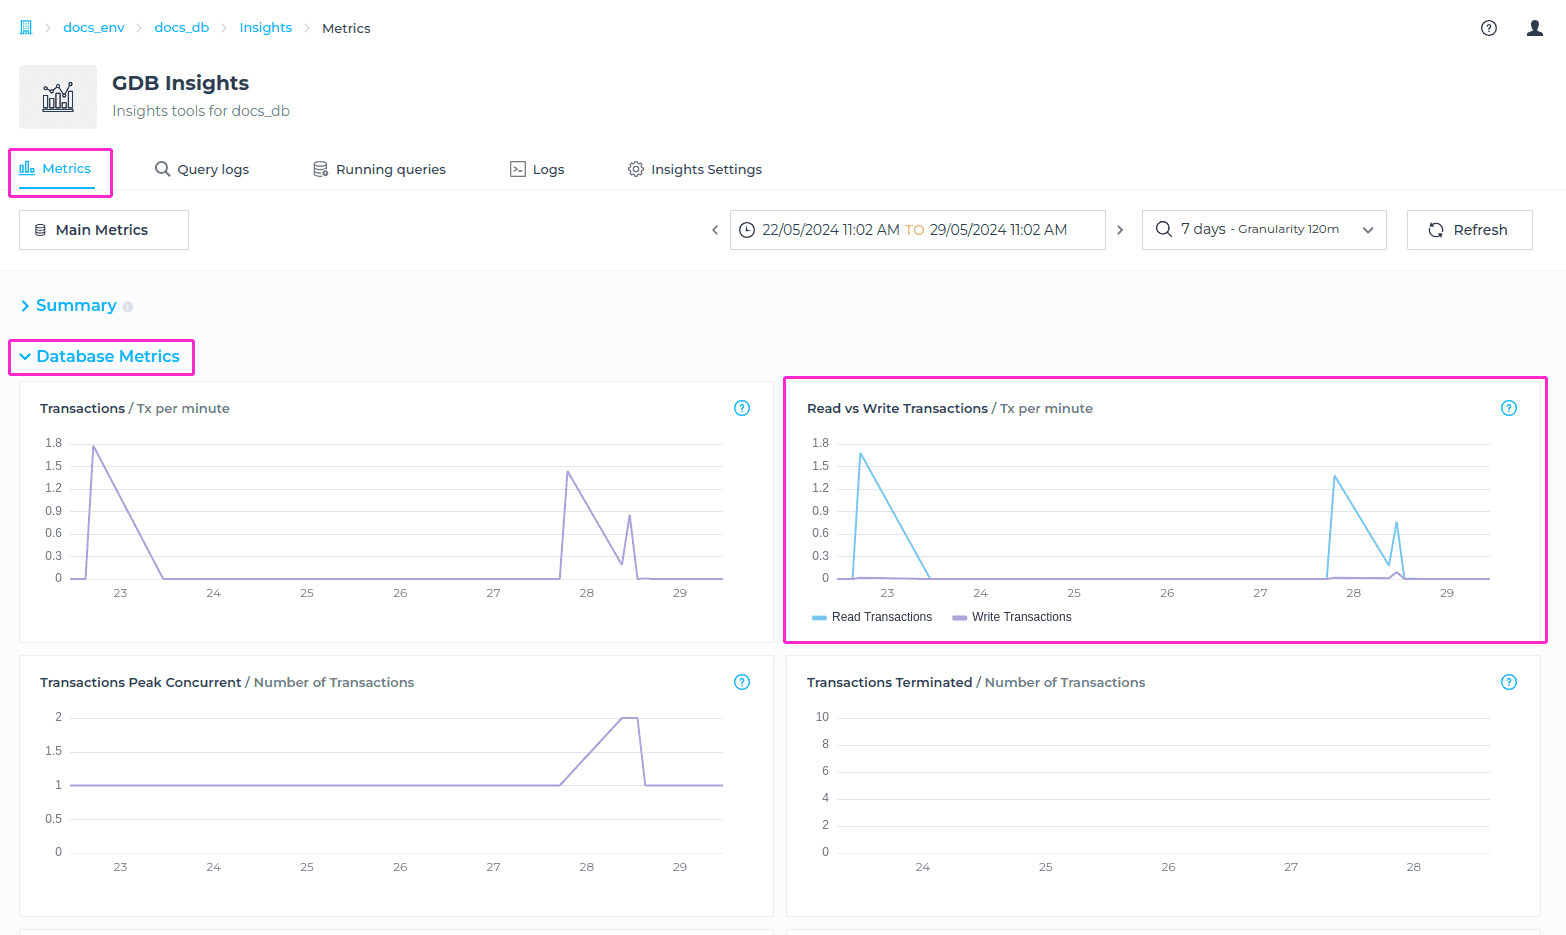
Read vs Write Transactions
Read vs Write Transactions metric refers to the ratio of read operations to write operations that occur within the database system over a one-minute time interval, for the selected timeframe.
Transactions Peak Concurrent
Transactions Peak Concurrent metric refers to the maximum number of simultaneous transactions occurring within the database system during a specified time period.
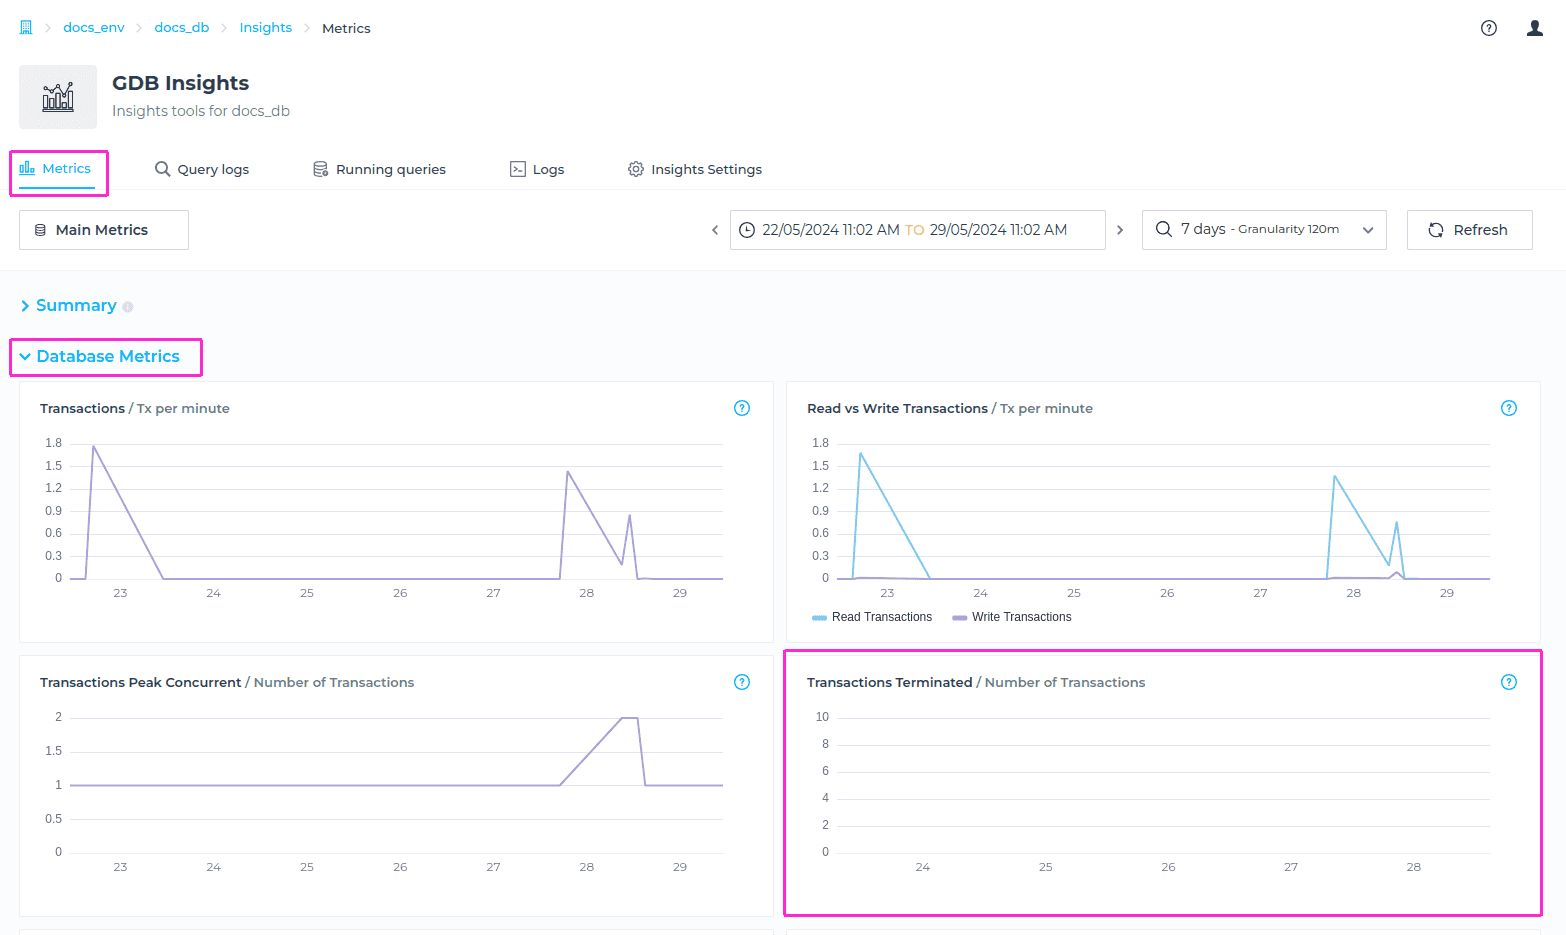
Terminated Transactions
The metric Terminated Transactions refers to the number of transactions that were initiated but did not complete successfully or were terminated before reaching completion, over the selected timeframe.
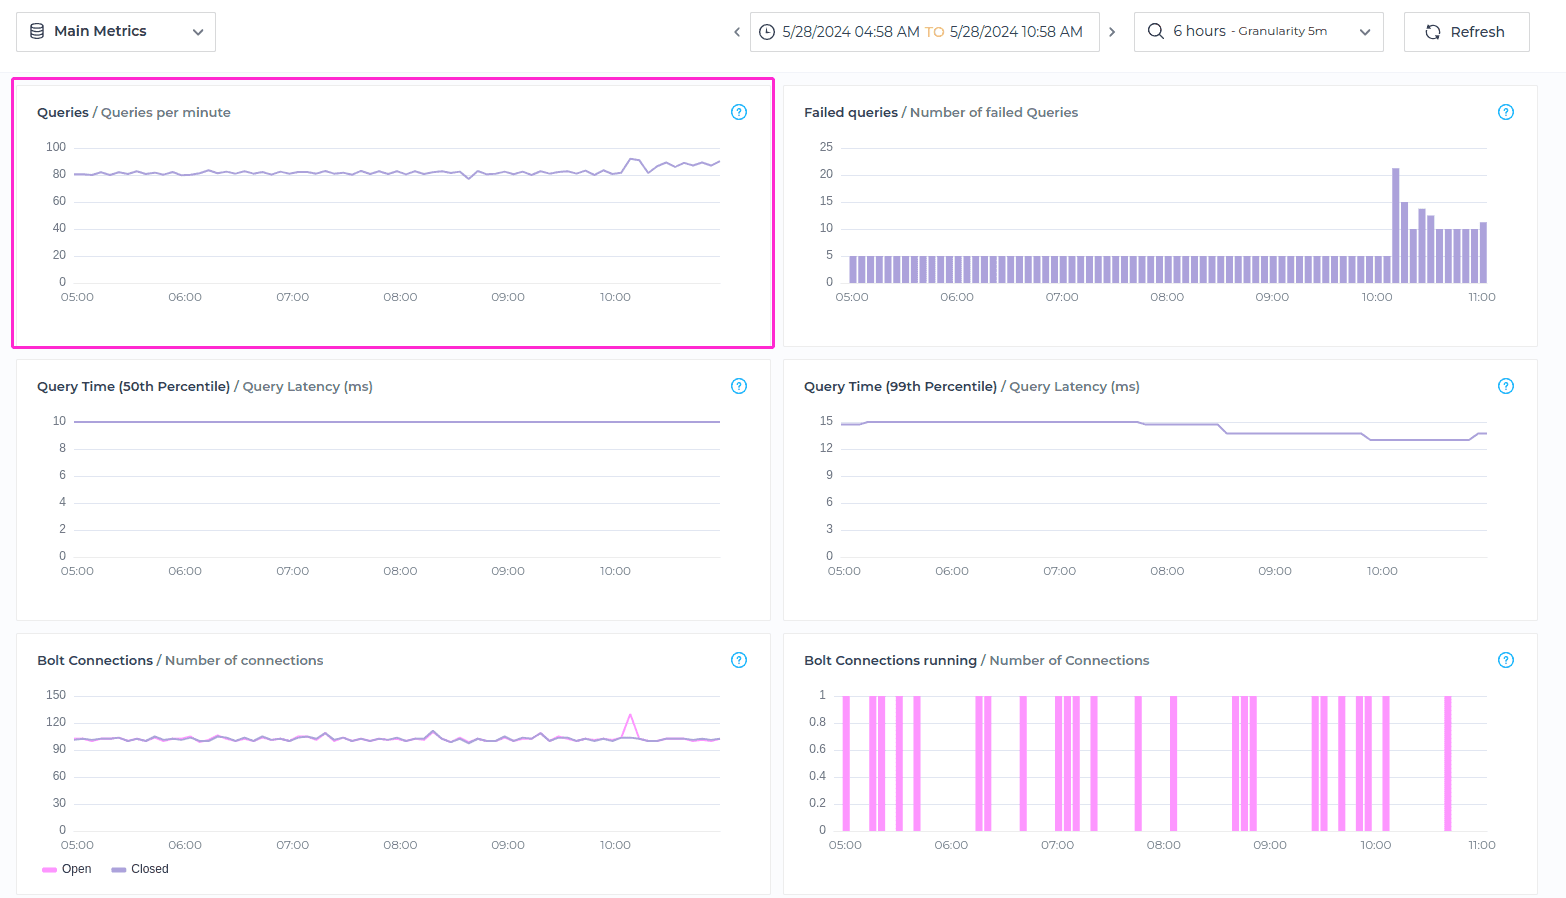
Queries
Queries metric refers to the count of queries executed during a specific time period, measured in queries per minute.
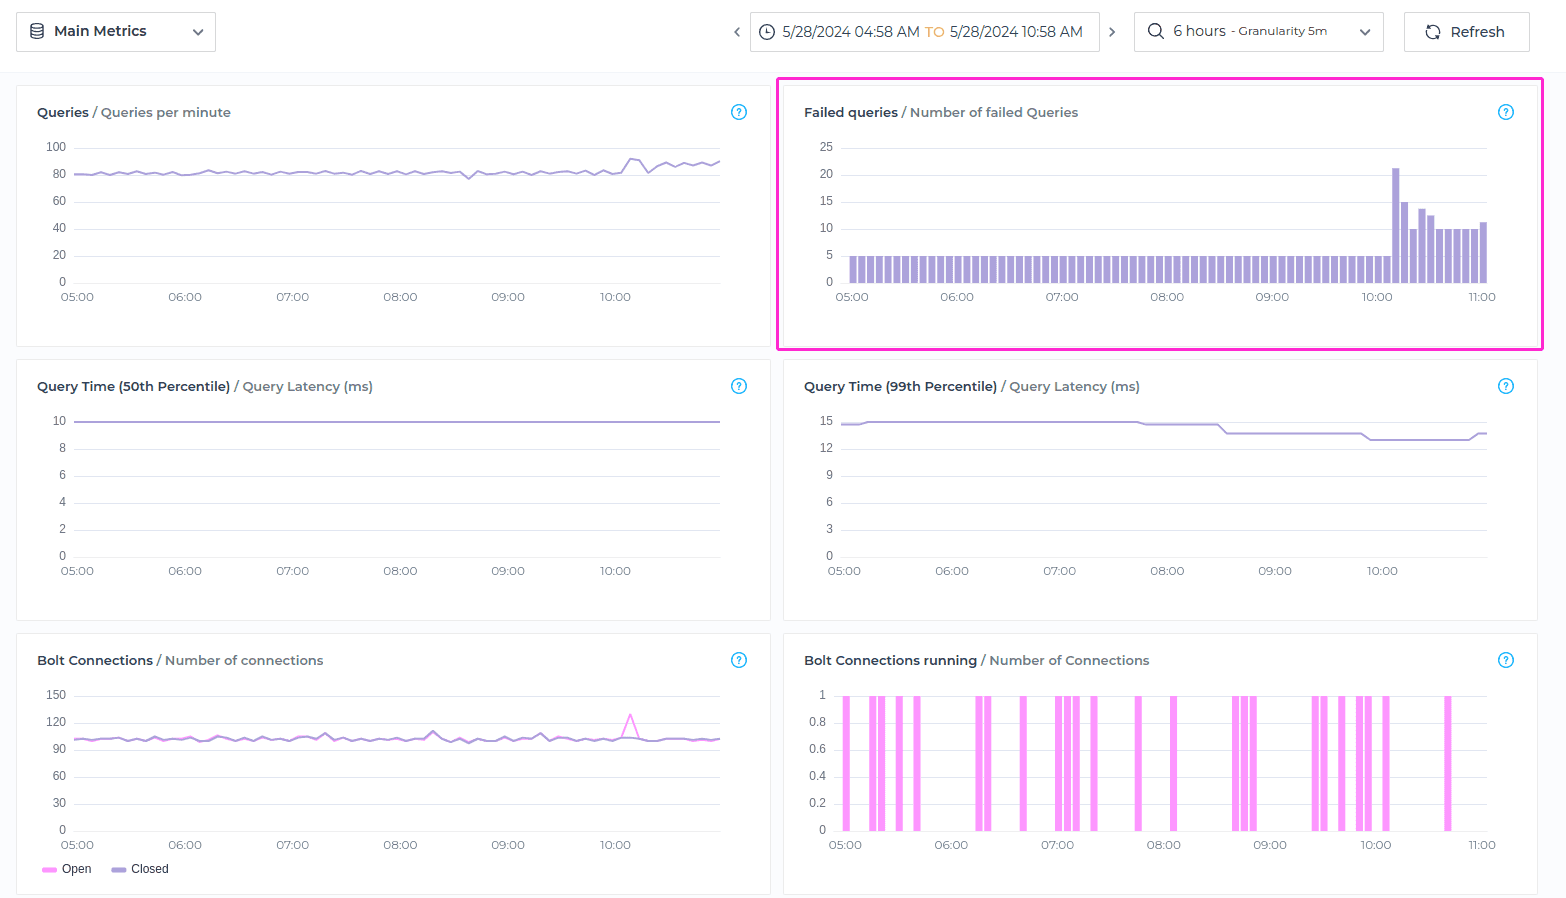
Failed Queries
Failed Queries metric refers to the count of queries that failed to execute successfully during a specifed timeframe.
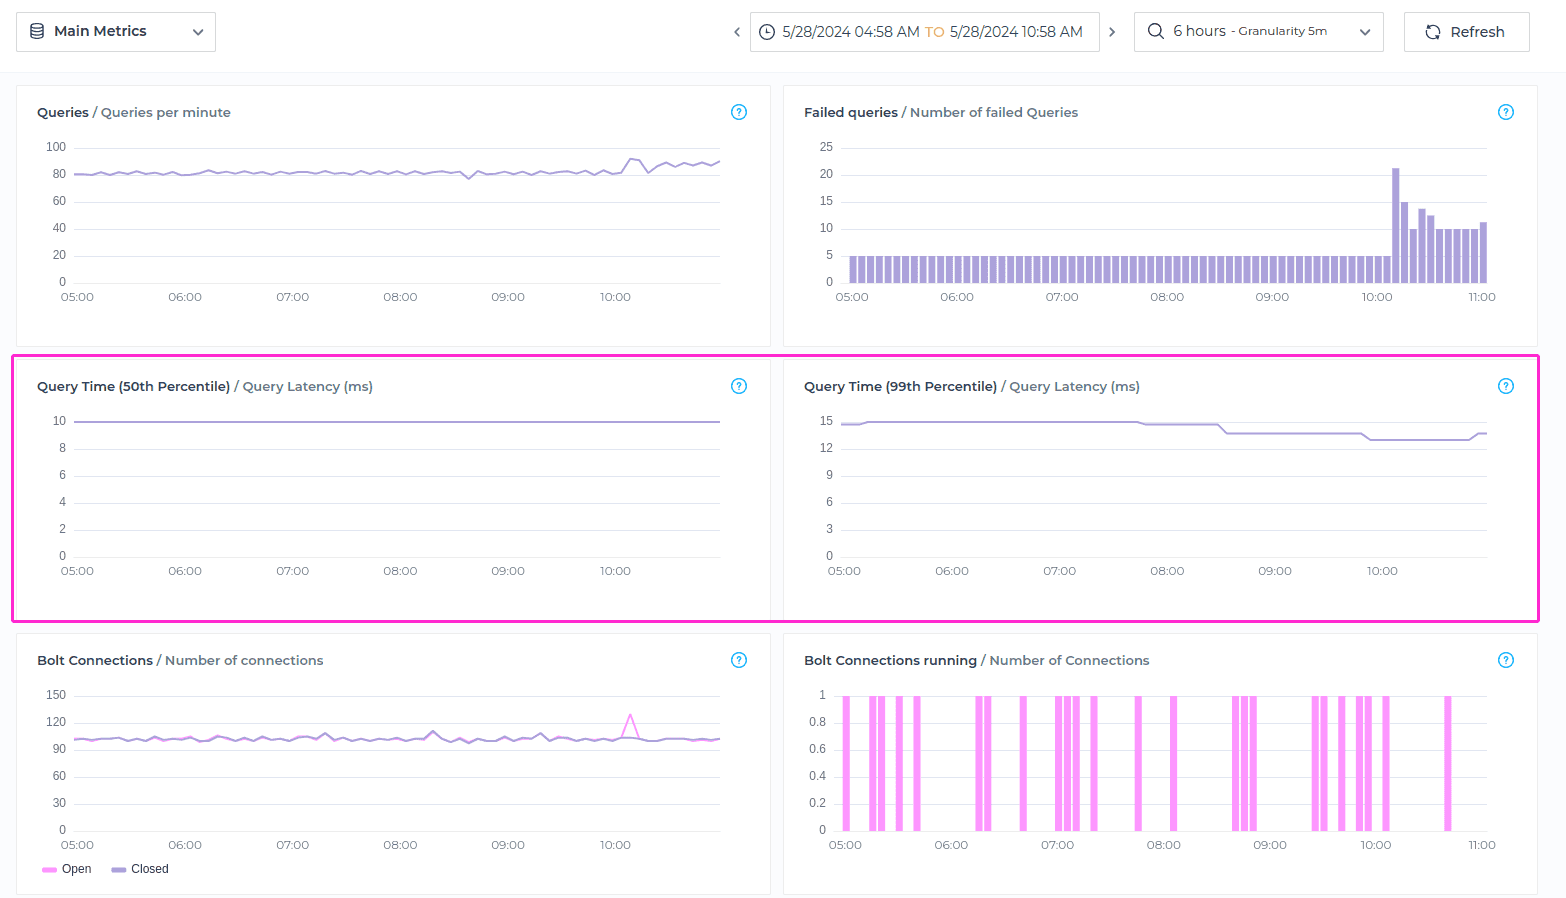
Query Time
Query Time (50th Percentile) / Query Latency (ms) metric shows how long queries take to execute (in millisecons), for the selected timeframe. It indicates the median time taken for queries to execute successfully.
Query Time (99th Percentile) / Query Latency (ms) indicates the maximum time taken (in milliseconds) for queries to execute successfully for 99% of the queries. This metric reflects the upper bound or worst-case scenario for query execution times.
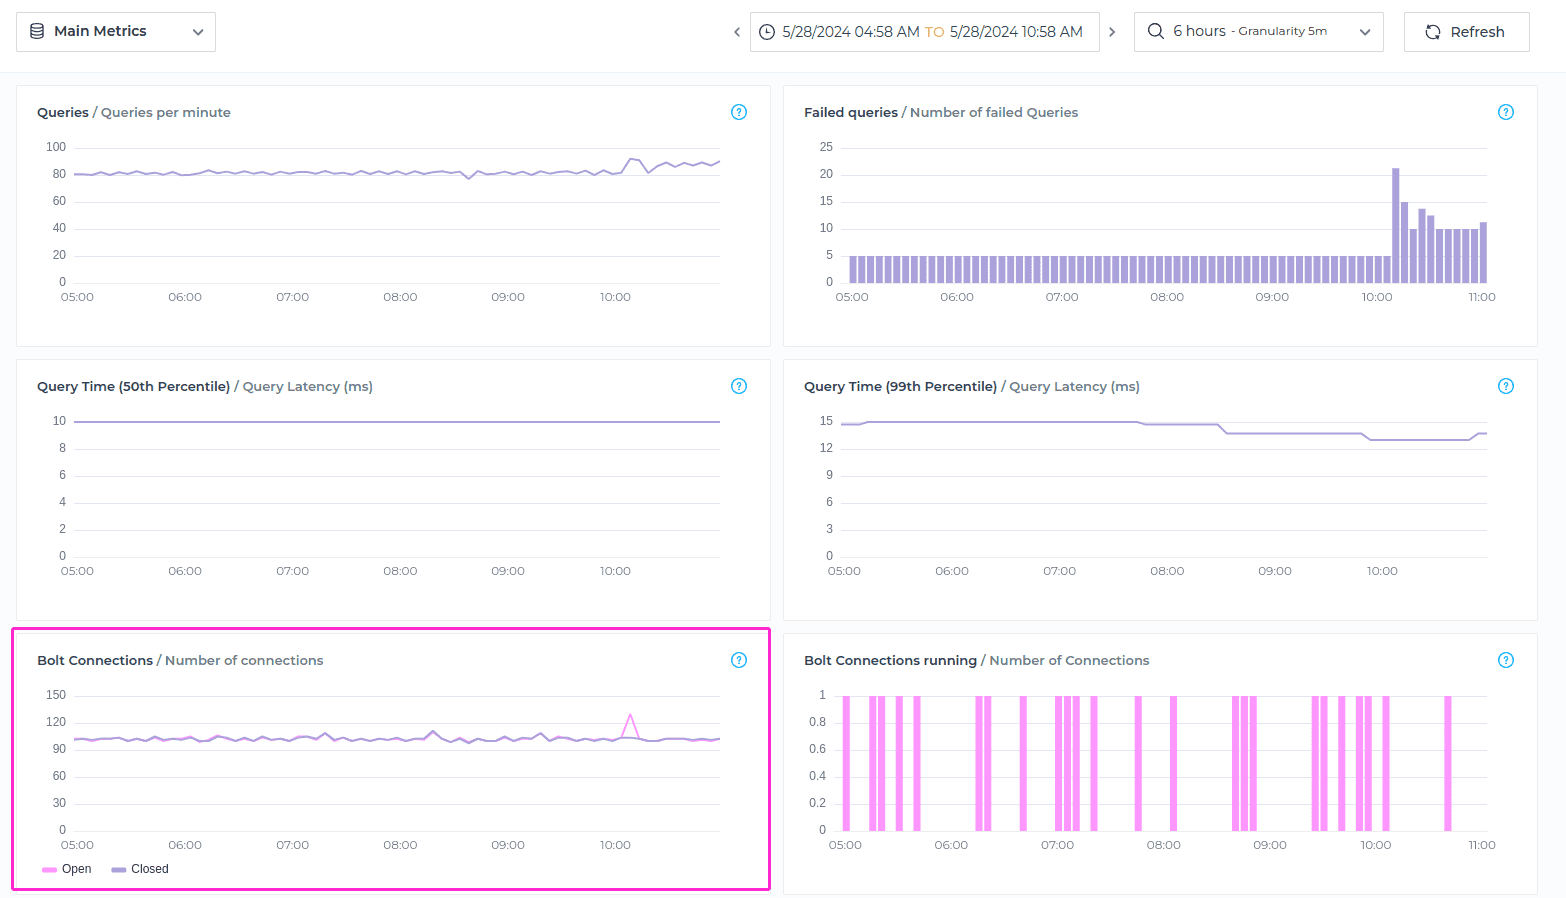
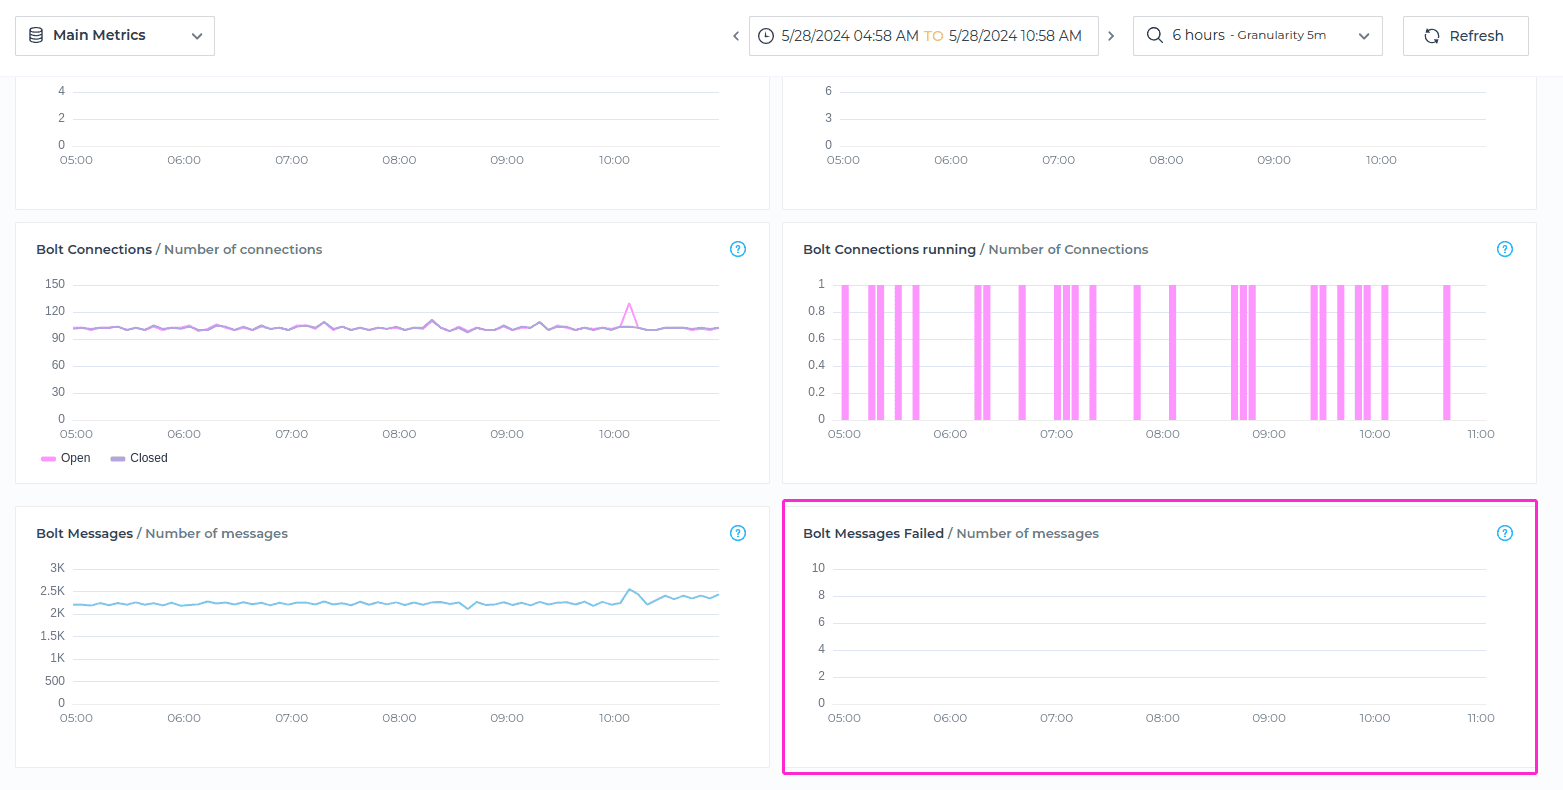
Bolt Connections
Bolt Connections metric indicates the number of open and closed connections established between client applications and the database using the Bolt protocol, for the specified timeframe.
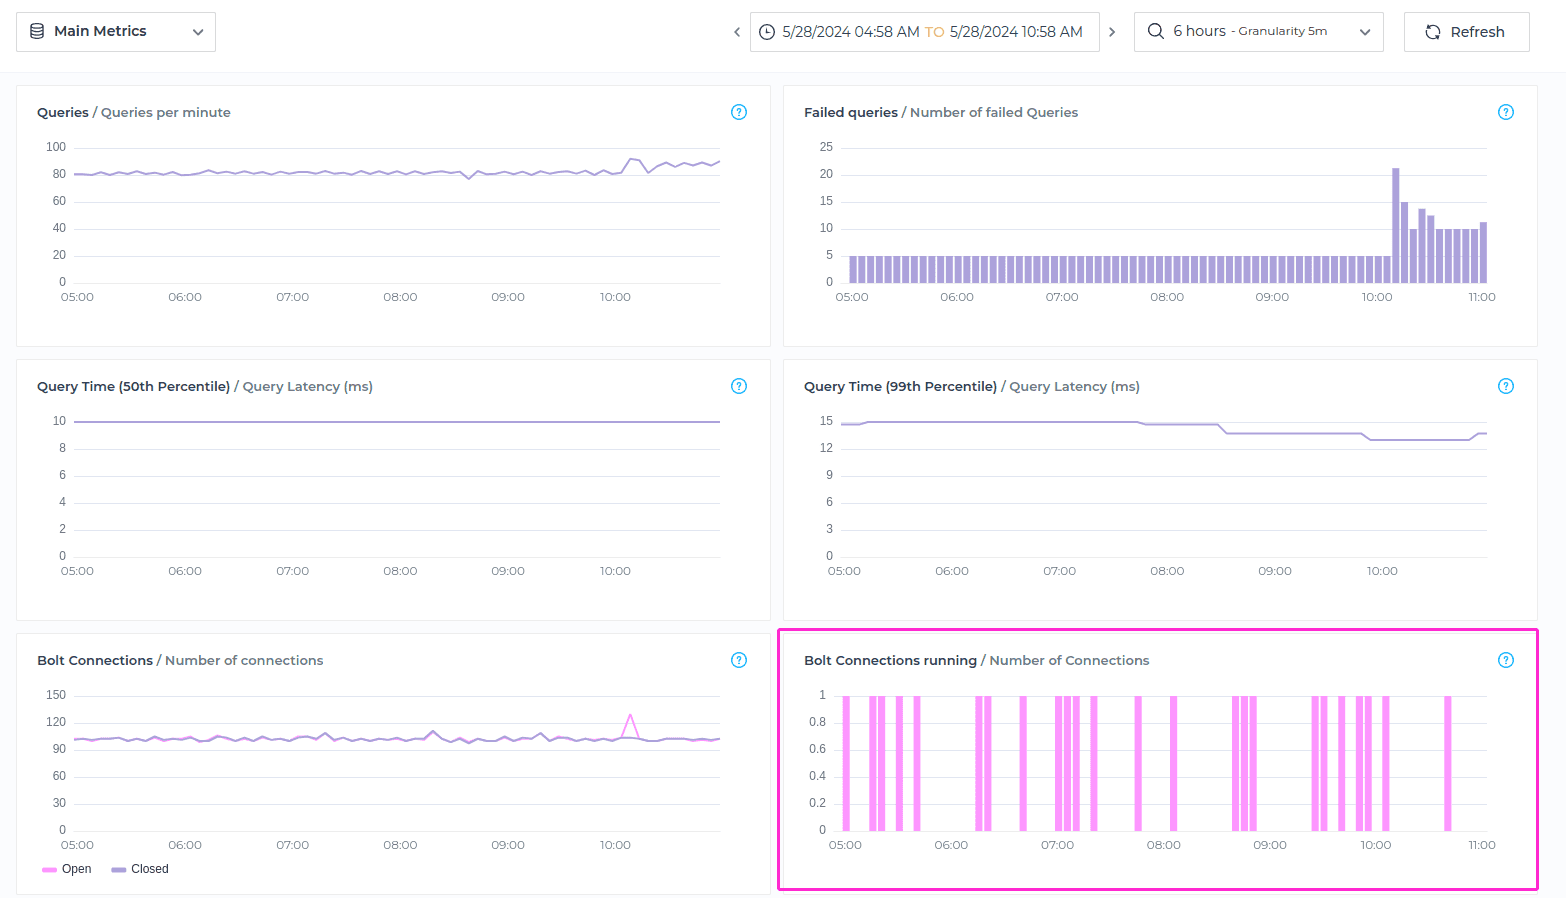
Bolt Connections Running
Bolt Connections Running metric refers to the count of active connections that are currently running and actively processing requests using the Bolt protocol for the specified timeframe.
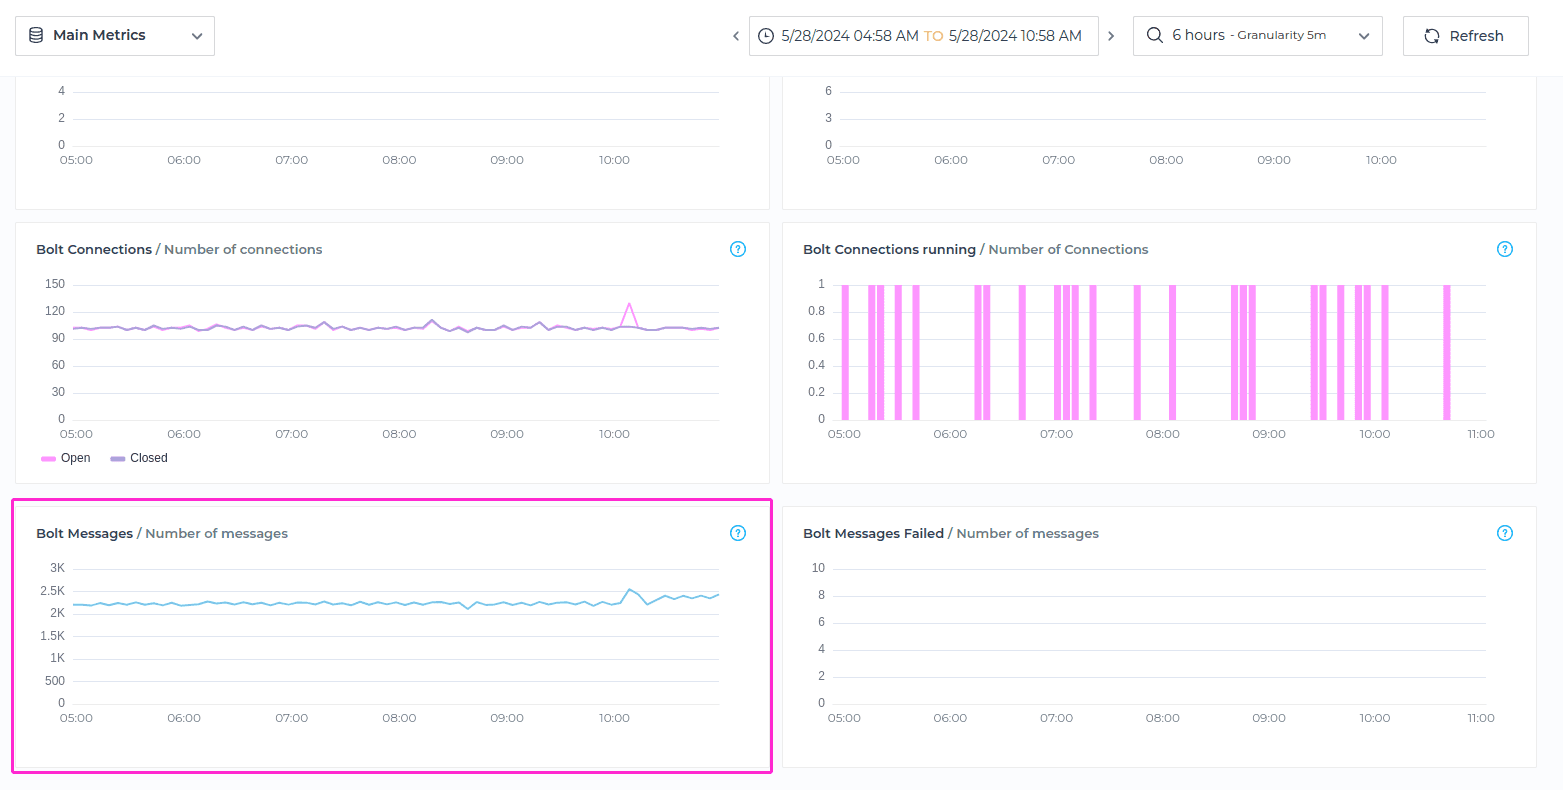
Bolt Messages
Bolt Messages metric indicates the volume of communication activity between the client application and the database using the Bolt protocol, for the specified timeframe. It reflects the number of messages transmitted back and forth during client-server interactions, including query requests, responses, status messages, and other communication events.
Bolt Messages Failed
Bolt Messages Failed metric refers to the count of messages that encountered errors or failures during transmission between the client application and the database using the Bolt protocol, for the selected timeframe.
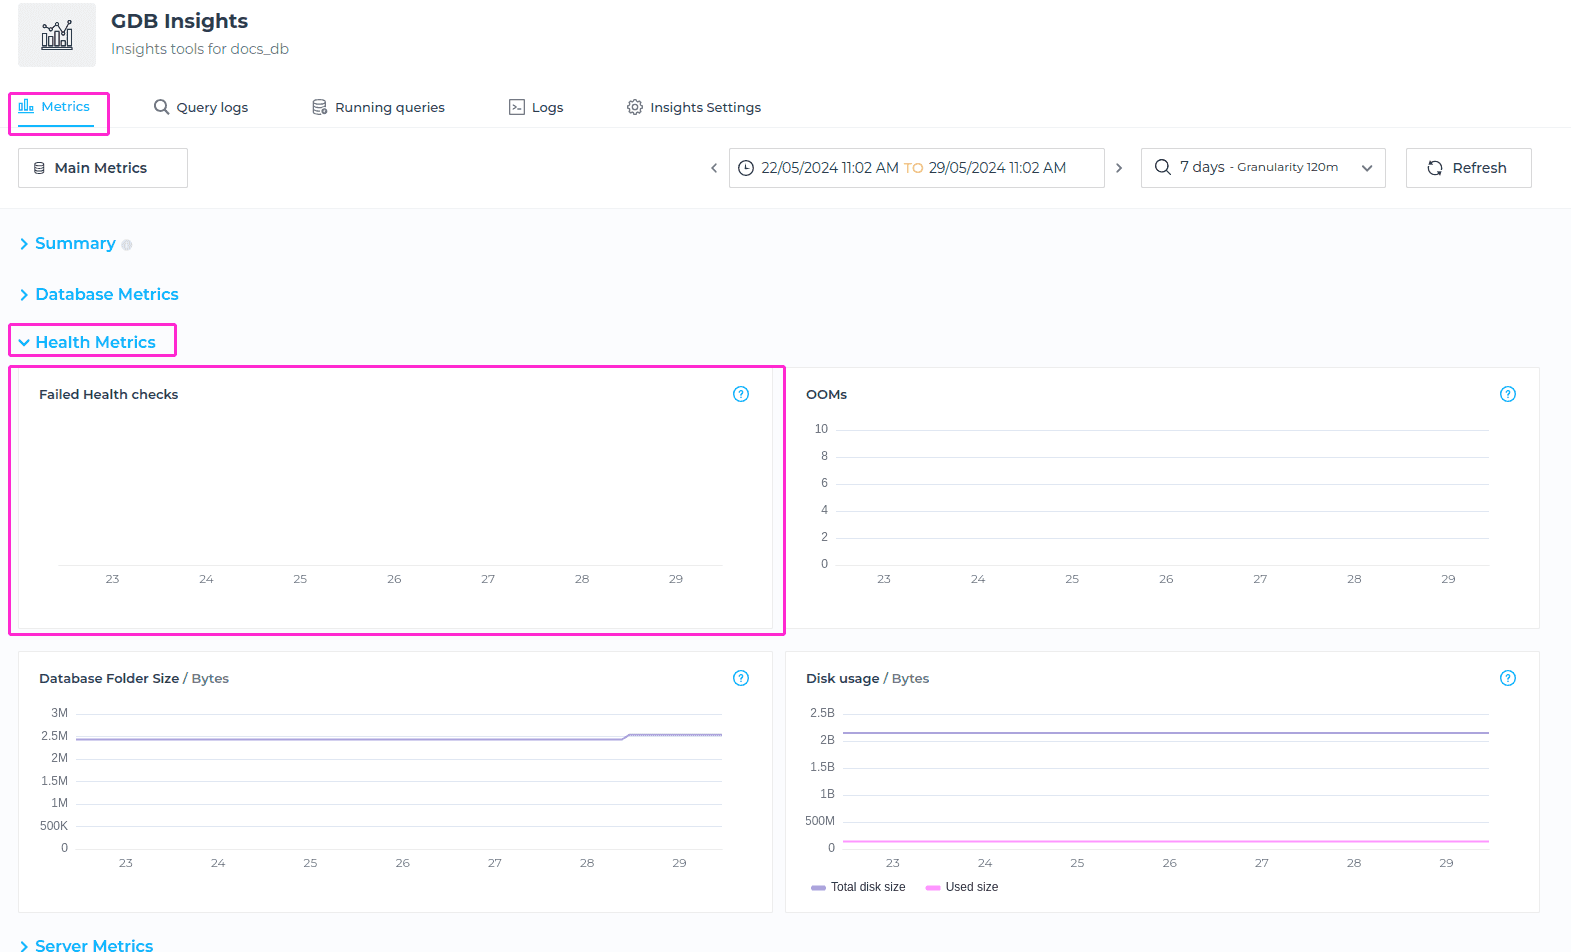
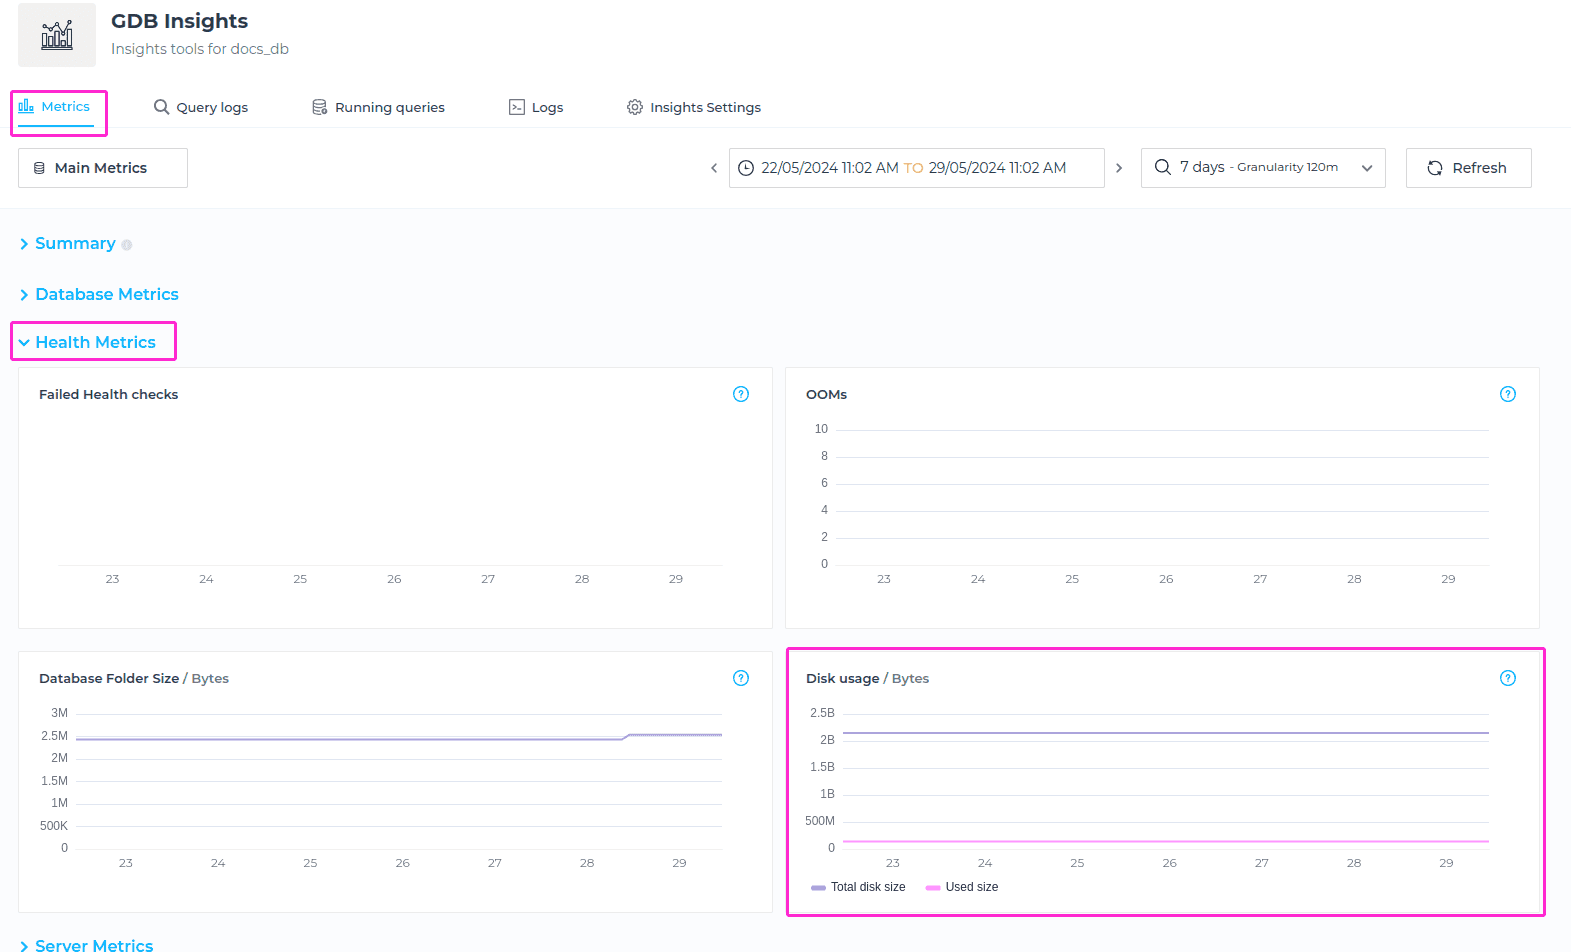
Health Metrics
In the Health Metrics section of the Metrics tab you can find the following information:
- Health checks
- Out Of Memory (OOM) event count.
- Size of database’s data folder
- Total and used size of available disk
Health Check
Health check is basically showing the result of the health check GrapheneDB does to your database http endpoint. Health check verifies that the database is up and running and important to note is that when the database is paused, the health check metrics are not pulled.
Health check is done every 5 minutes, but you can alway refresh to check the most recent status. If there is a failed health check that happened, you will see the count here.
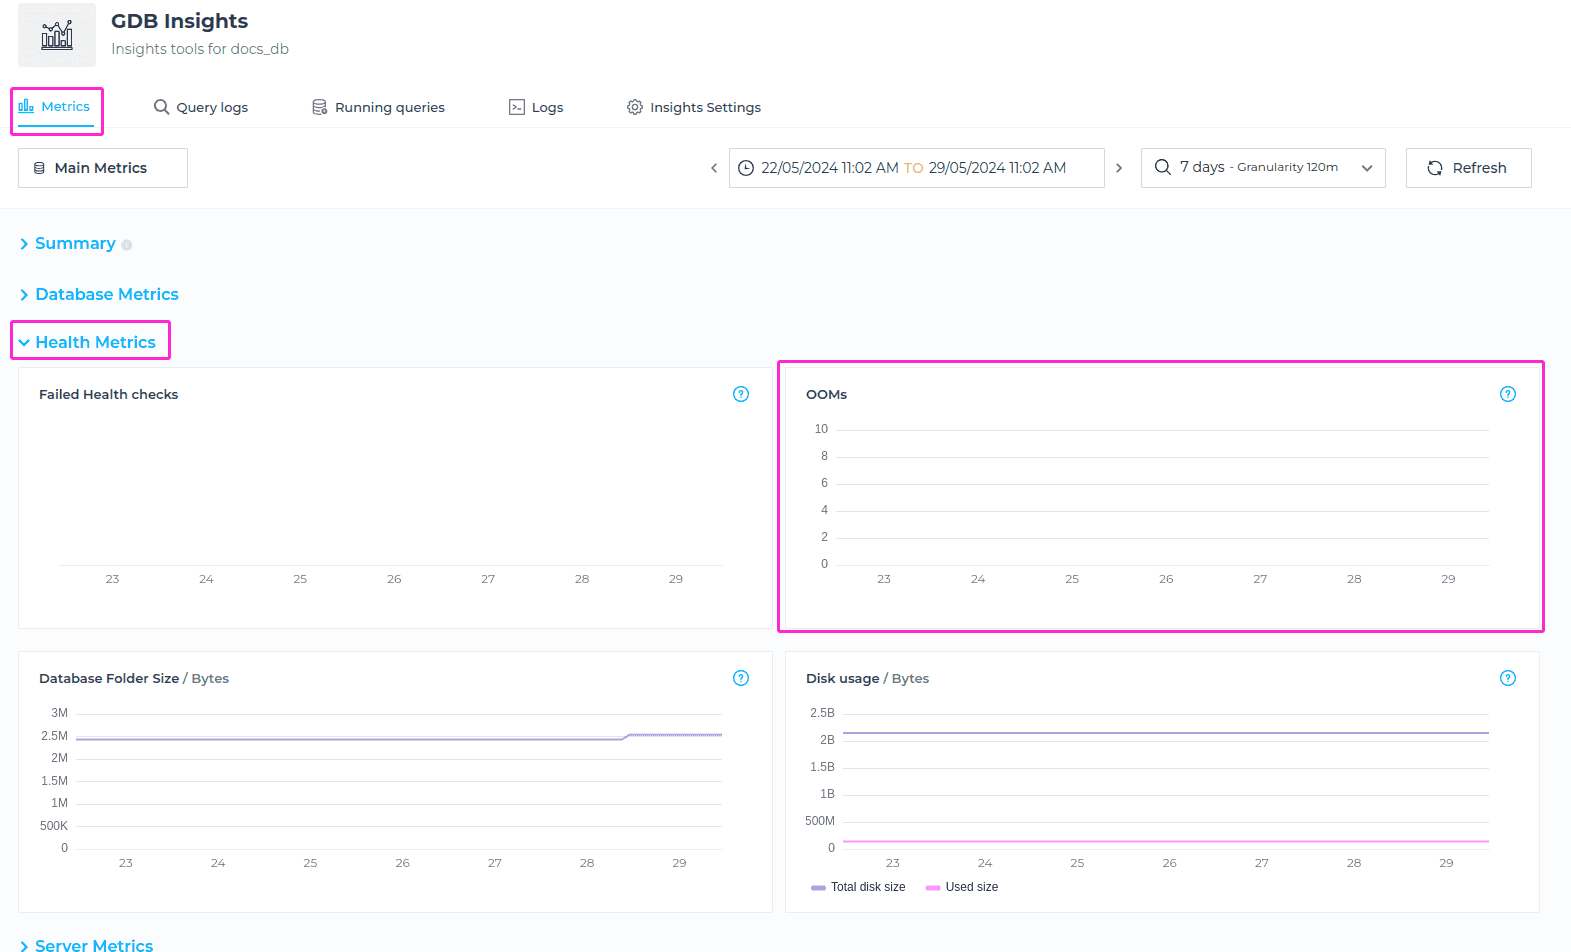
Out of Memory errors
The Out of Memory (OOMs) metric shows the number of times OOMs occured for the selected time window. Out of memory errors in a database occur when the database system exhausts its allocated memory resources and is unable to fulfill memory requests from running processes or queries.
Database Folder Size
The Database Folder Size metric shows the total size of the data folder.
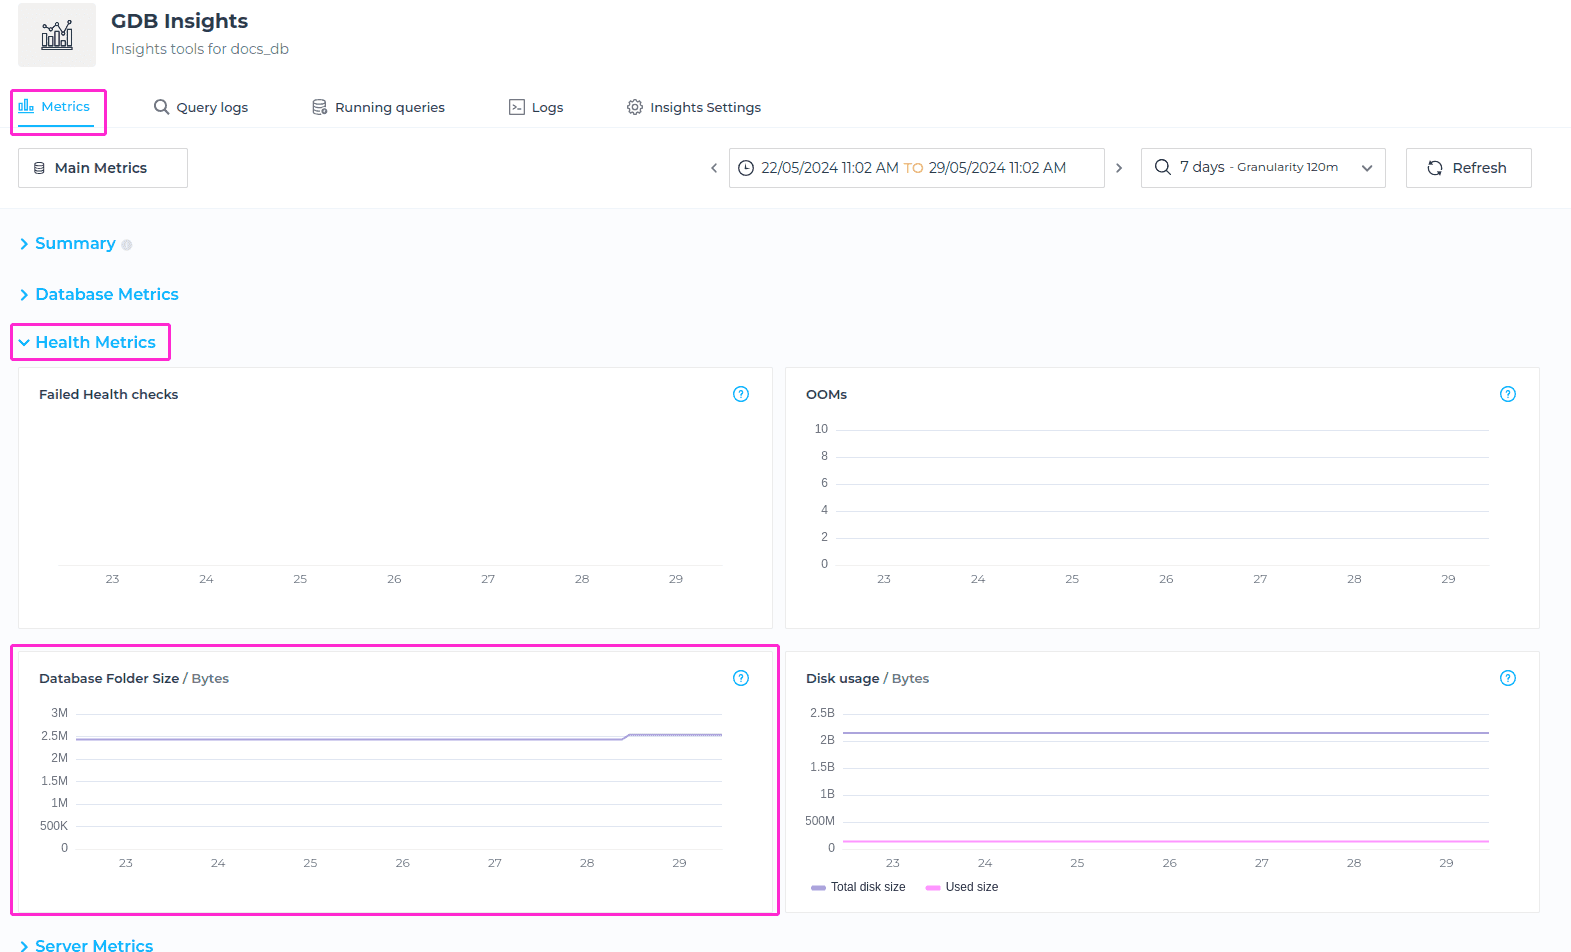
Disk Usage
Disk Usage metric retrieves total and used size of available disk. When the disk approaches full capacity, it can lead to performance degradation. By monitoring the used size, you can take proactive steps such as deleting unnecessary data to maintain optimal performance. Please note the important point when it comes to deleting data: Even when you clean up some data, deleting in Neo4j doesn’t free up disk space. You can just use the space of the deleted data for new writes. This is because Neo4j needs to keep the information of the ids ready to be reused.
If you need to reclaim the space, please Open a Support Case and our support team will advise on how it can be done.
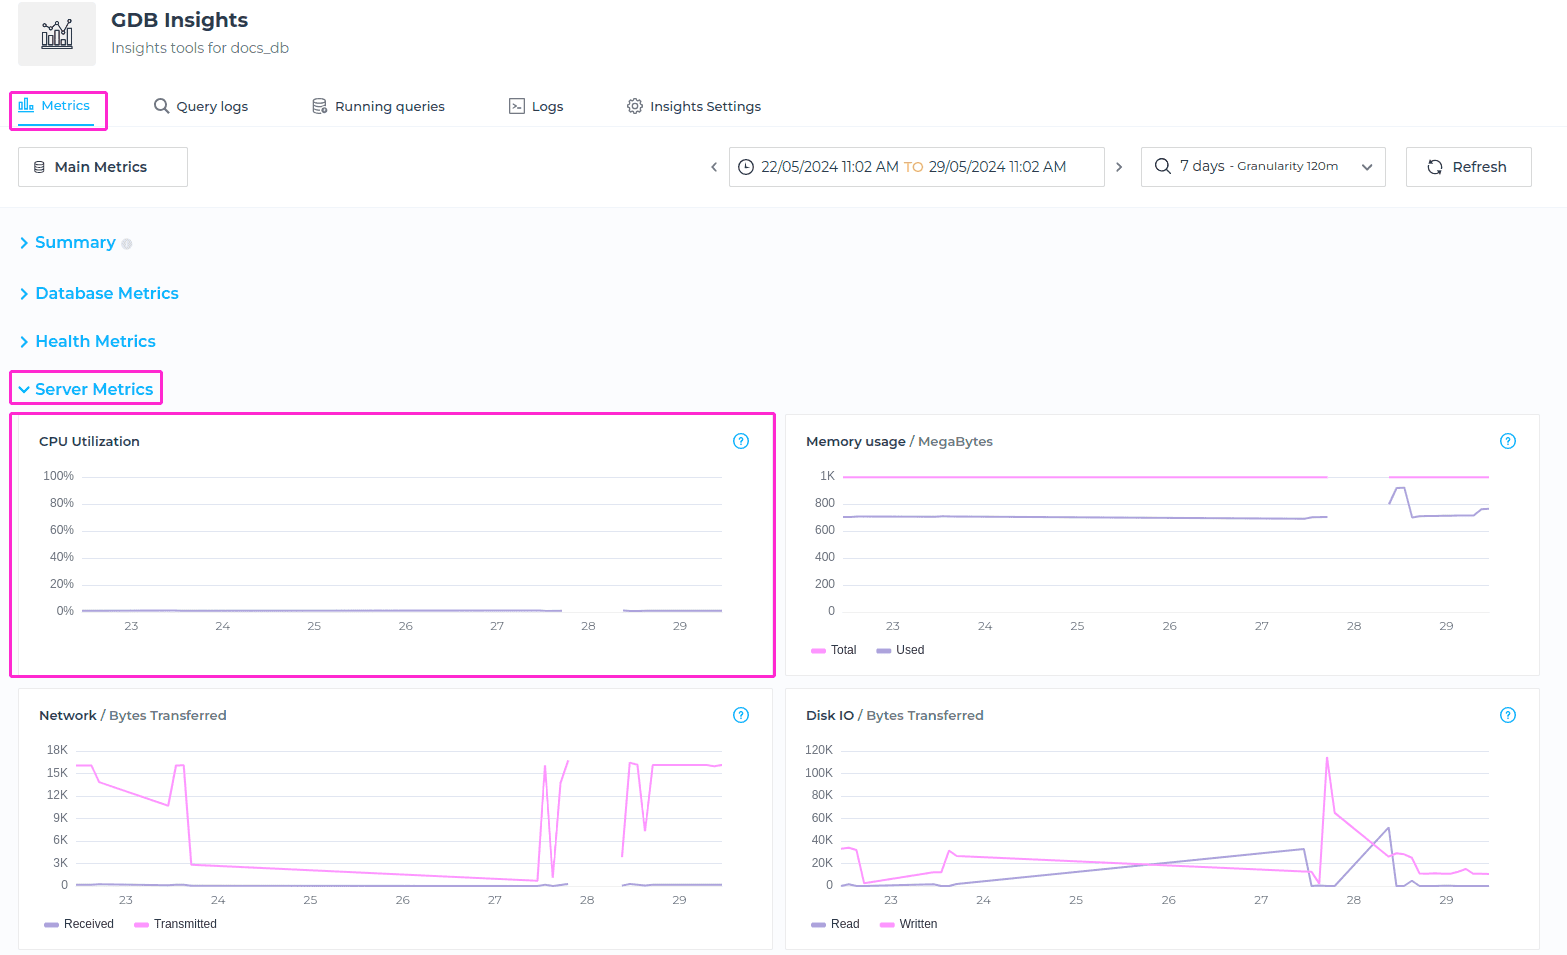
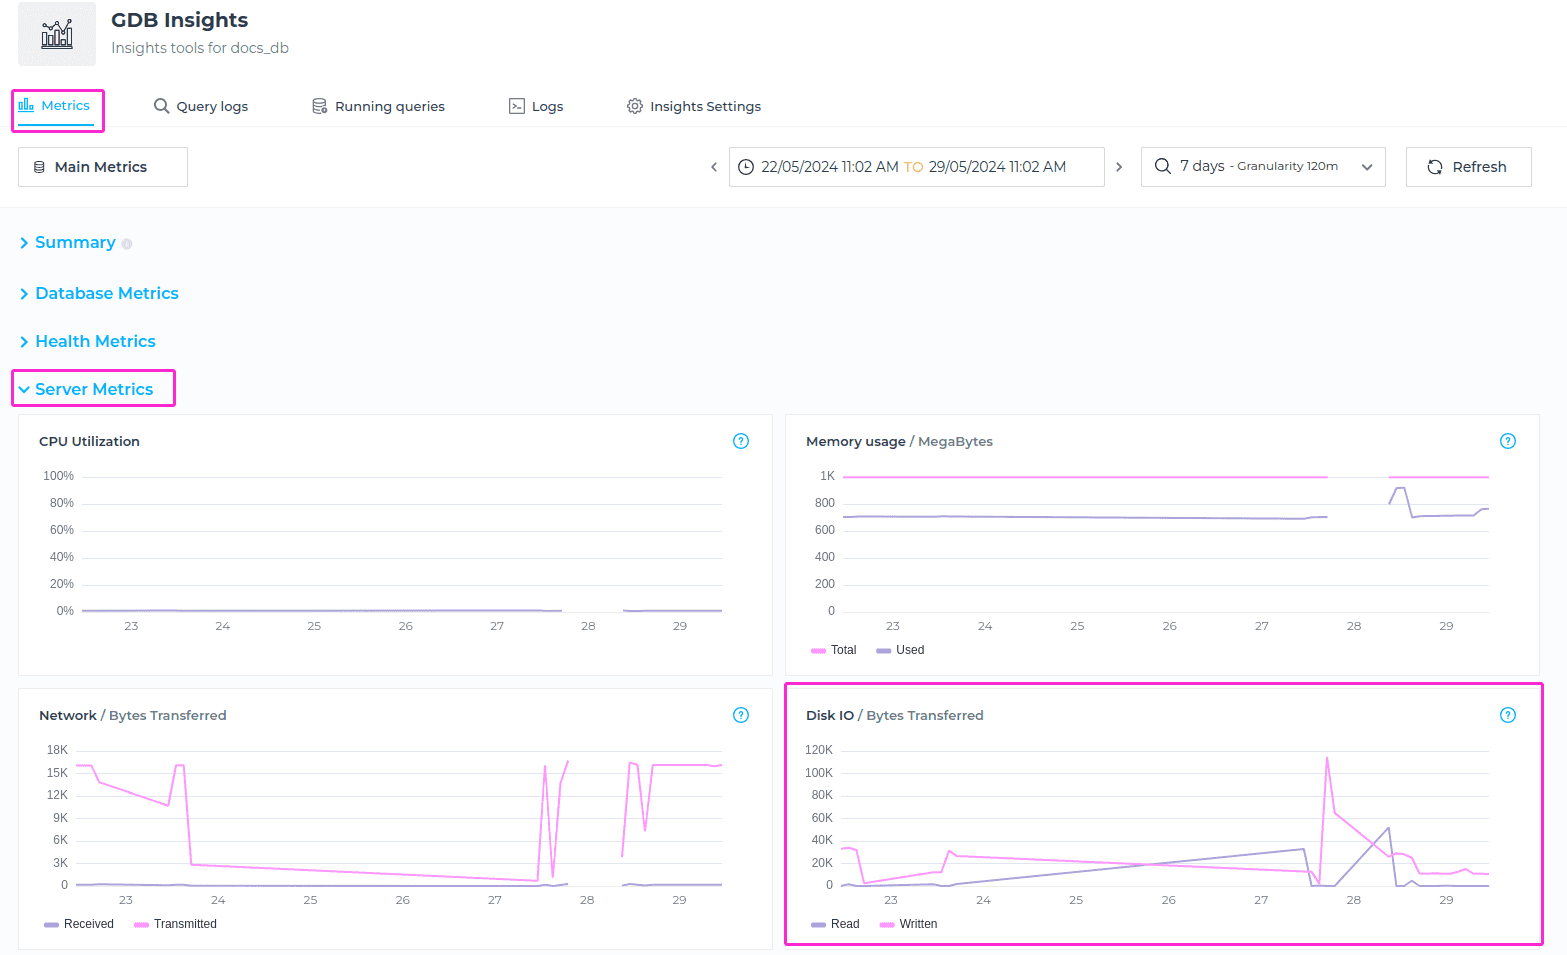
Server Metrics
In the Server Metrics section of the Metrics tab you can find the following information:
- CPU utilisation
- Memory usage
- Network
- Disk I/O
- Heap & Non Heap
- JVM Garbage Collector Activity
- Number of JVM open files
- Classes Loaded by JVM
- Number of current threads
- Count of active Nginx connections
CPU Utilisation
The CPU Utilisation metric shows you the percentage of the server’s CPU that is being used by the deployment for the selected timeframe.
ℹ️ Info
Please keep in mind that the OS has a little amount of CPU designated for it, so when this metric is set to 100%, it means that the deployment process is utilizing all available CPU, not the entire server.
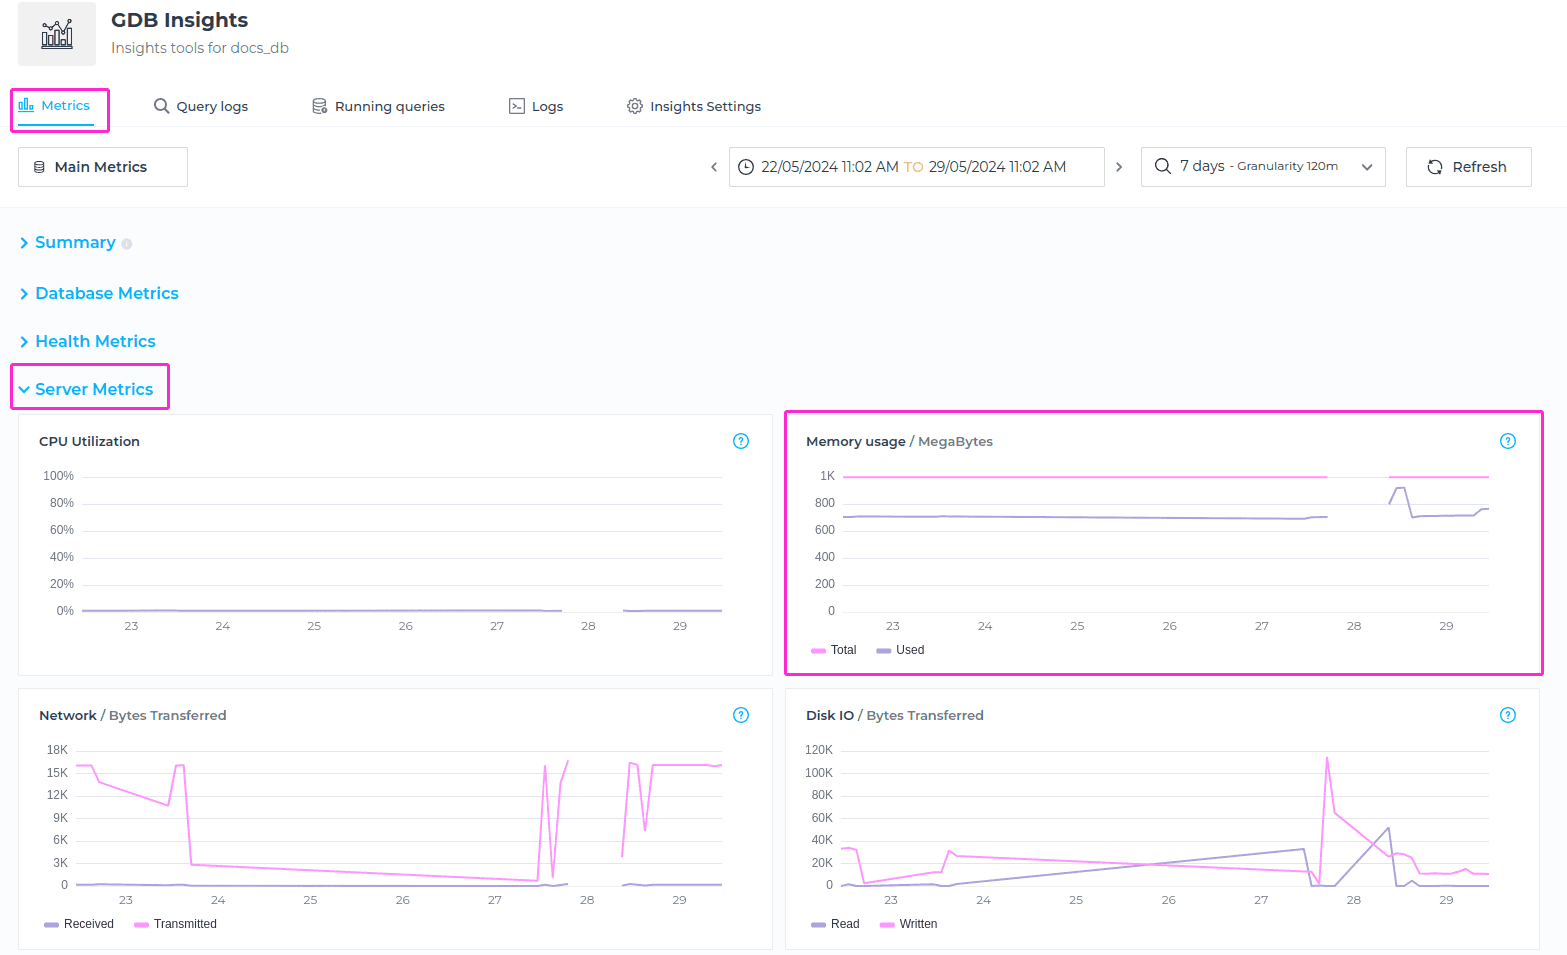
Memory Usage
The Memory usage metrics is showing the used and available memory for the selected timeframe, measured in MegaBytes.
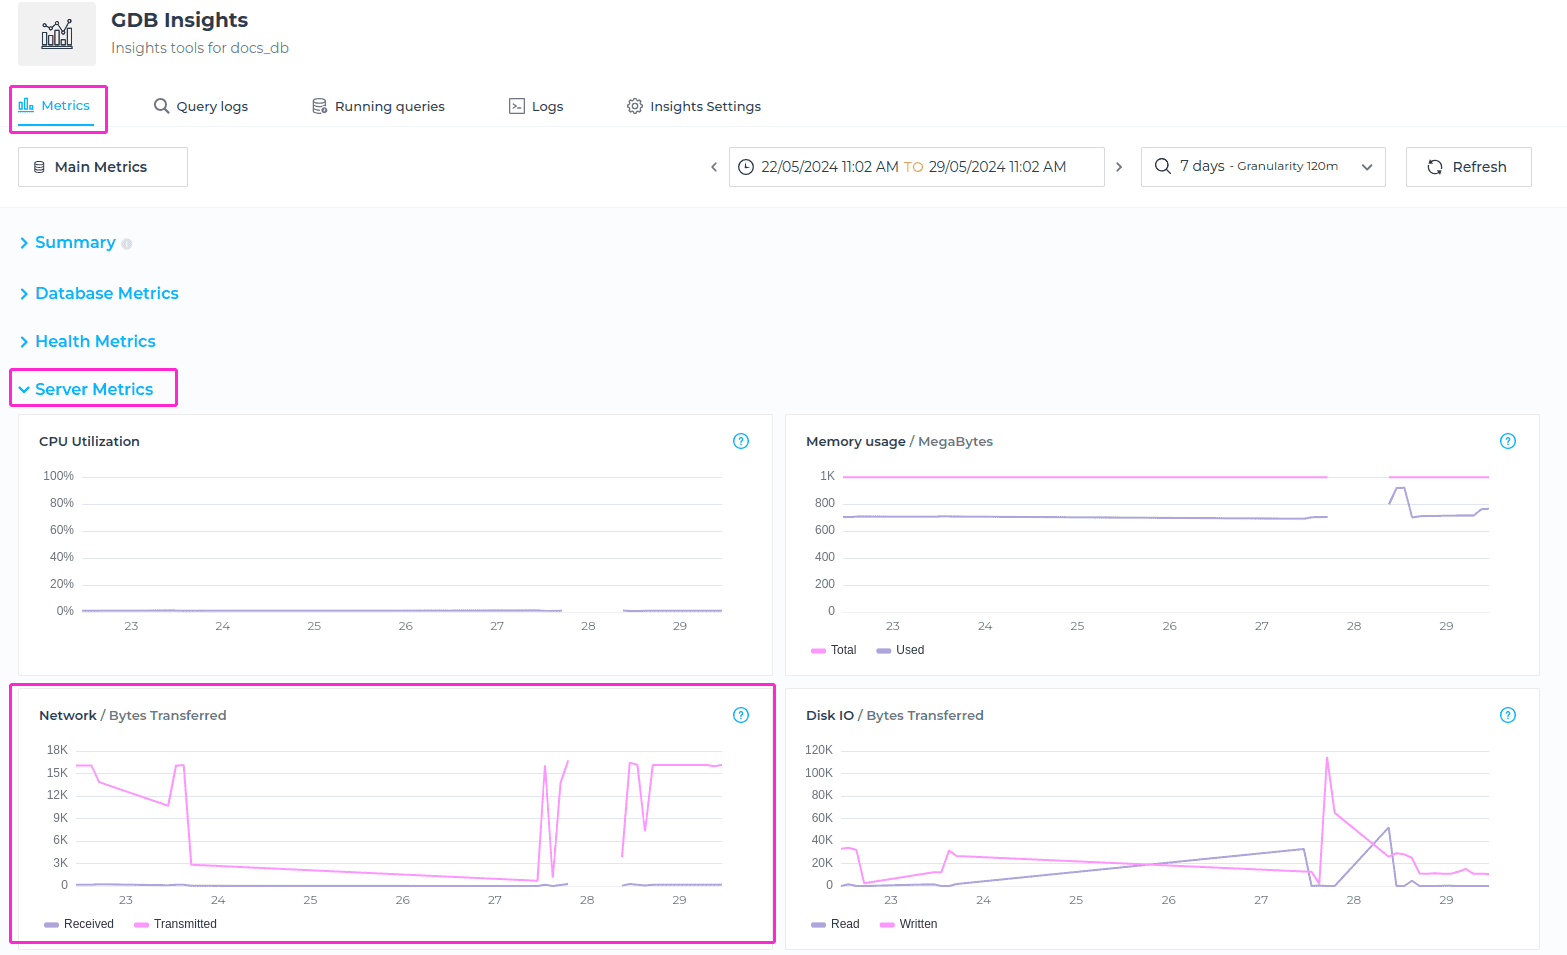
Network
The Network metric measures the amount of data transferred over the network, both incoming (received) and outgoing (sent), expressed in bytes.
Disk I/O
The Disk I/O metric calculates the sum of disk read and written bytes over a specific time period (X minutes), providing insights into disk input/output (I/O) activity and data transfer rates between the database and the disk storage subsystem.
Heap & Non Heap
The Heap & Non Heap metric fetches the used memory bytes in the heap and non-heap areas for the specified timeframe, providing insights into memory utilization within these memory spaces.
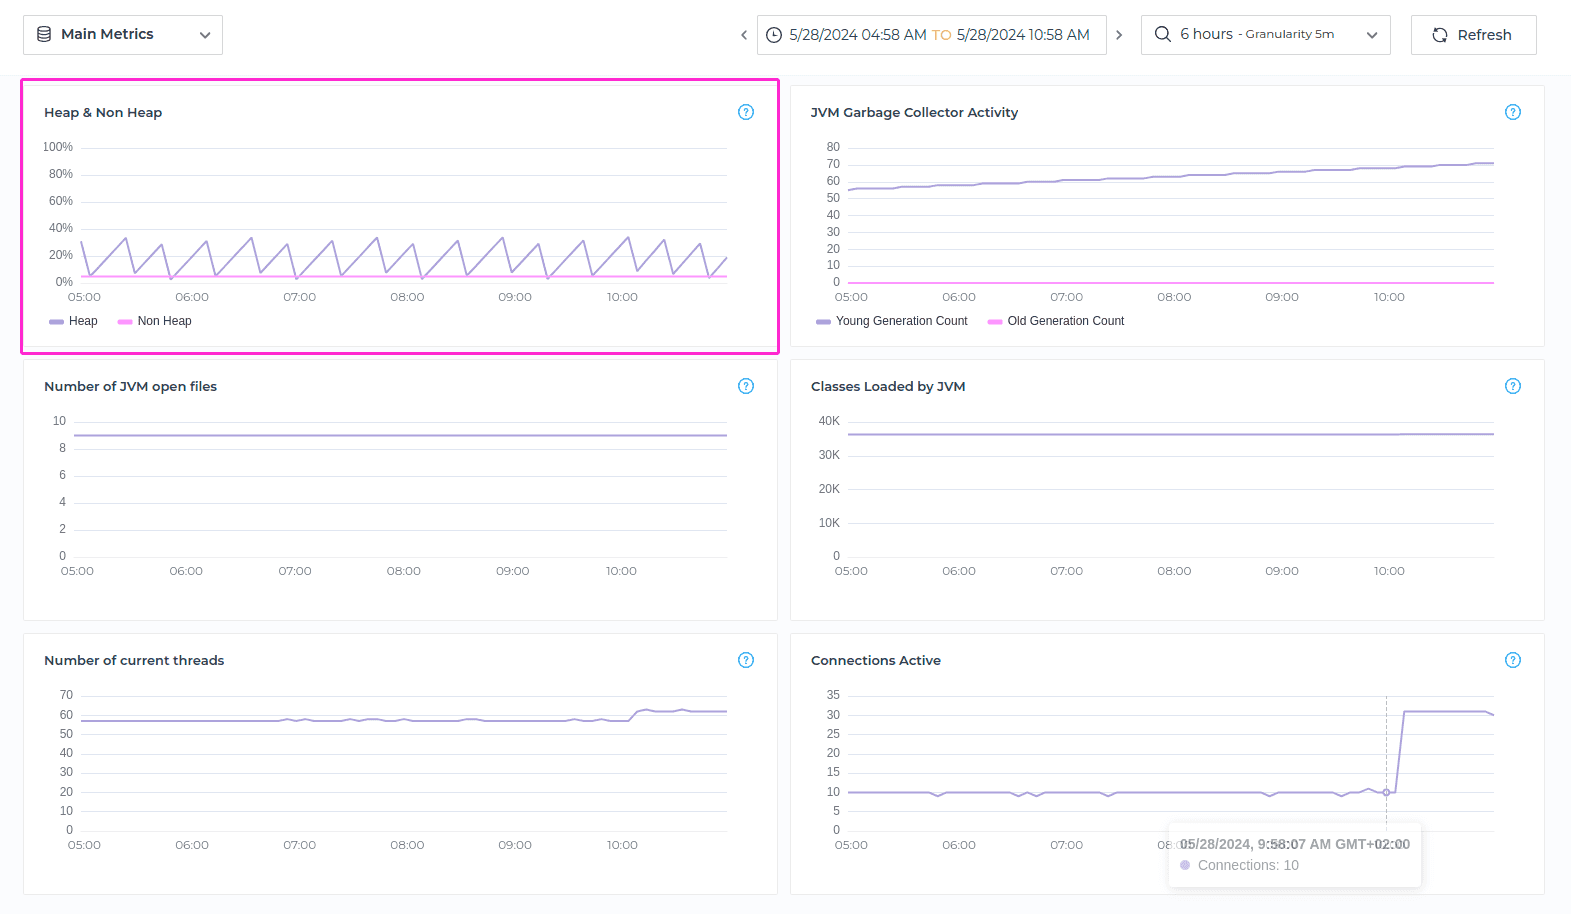
JVM Garbage Collector Activity
The metric JVM Garbage Collector Activity counts GC (Garbage Collection) collection seconds for the young and old generations in a database, for specified timeframe, providing insights into the efficiency of garbage collection processes within the Java Virtual Machine (JVM) running Neo4j.
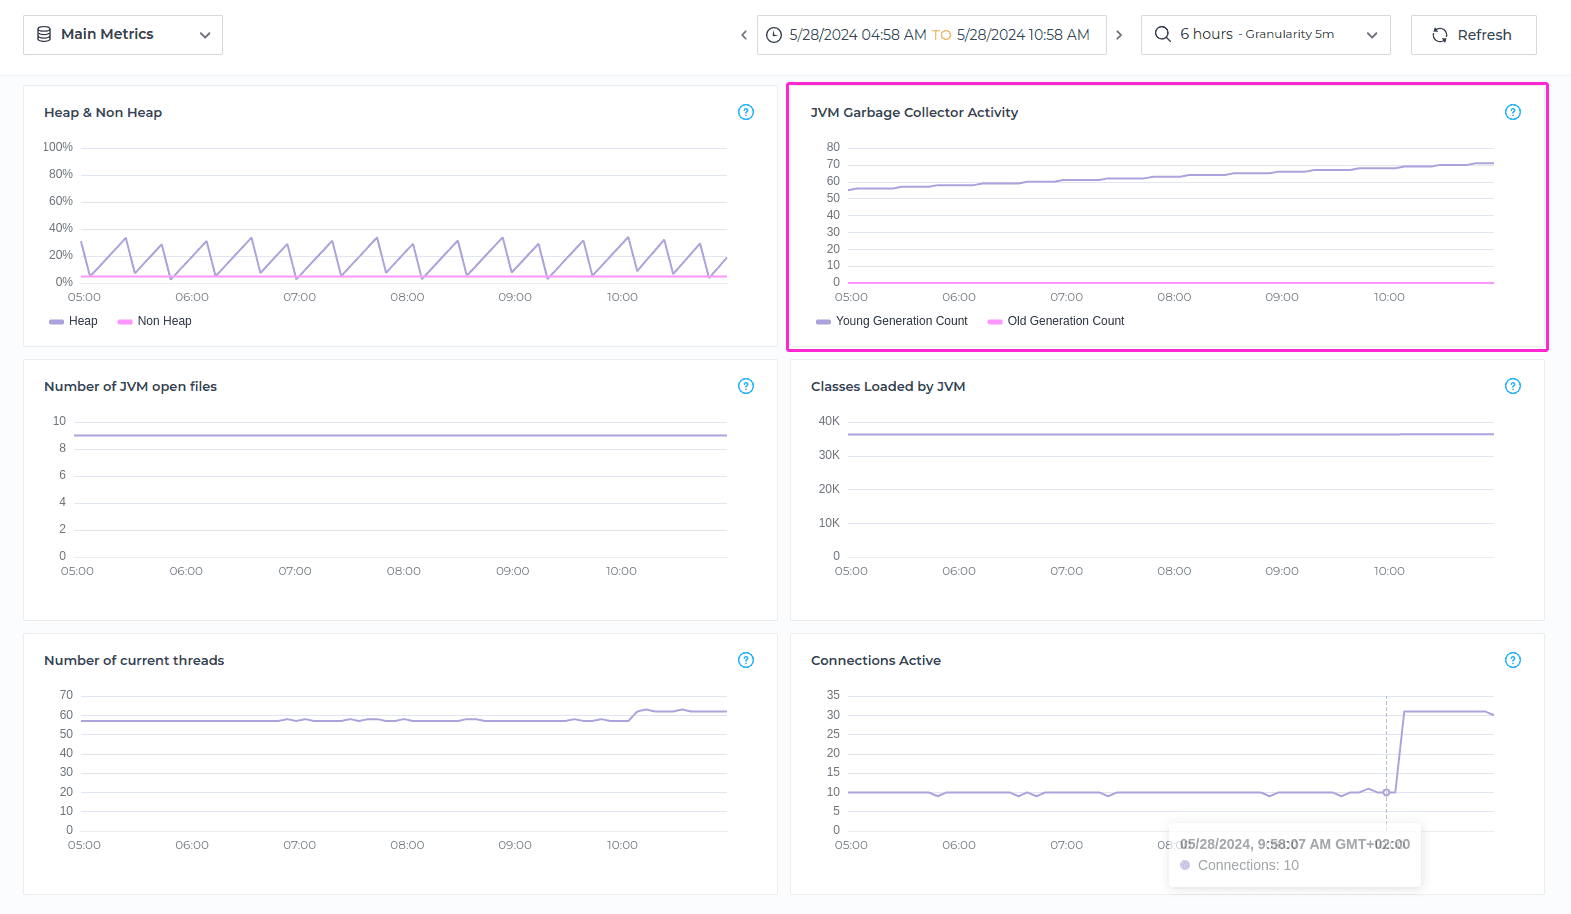
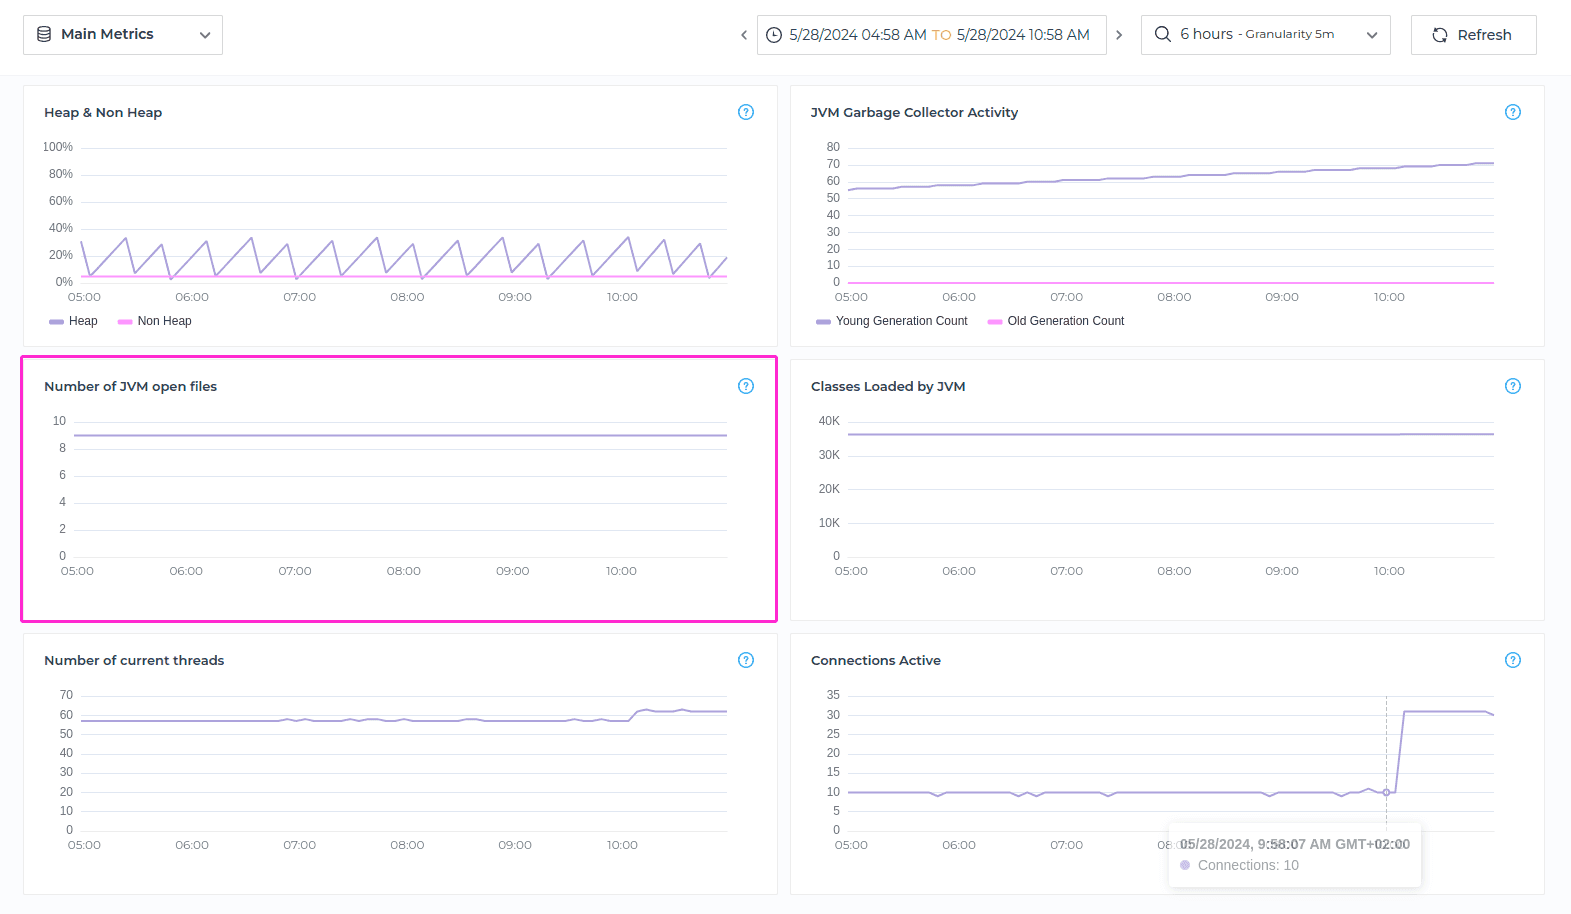
Number of JVM open files
The Number of JVM open files metric fetches the count of open file descriptors in a database, for the selected timeframe. File descriptor metrics contribute to performance monitoring and optimization. Excessive file descriptors or improper file handling practices can lead to performance degradation, increased system overhead, and potential I/O bottlenecks. Monitoring file descriptor counts helps in optimizing file I/O operations, reducing resource contention, and improving overall system performance.
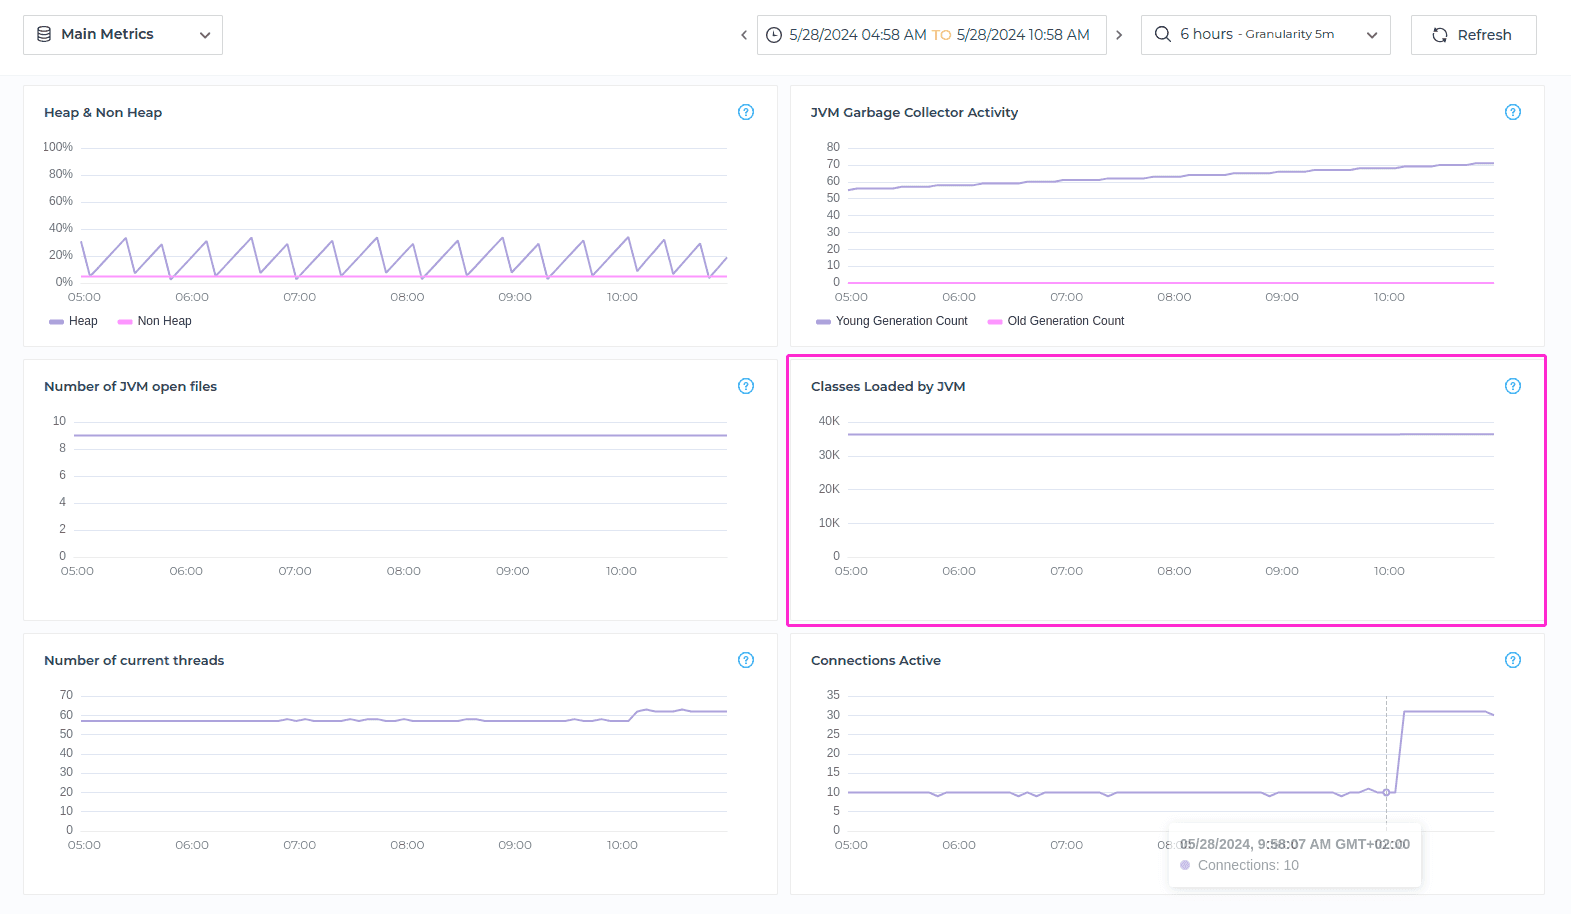
Classes Loaded by JVM
The Classes Loaded by JVM metric retrieves the count of classes loaded within a database’s Java Virtual Machine (JVM) for the specified timeframe, providing insights into the dynamic loading and usage of Java classes by the database and associated Java processes.
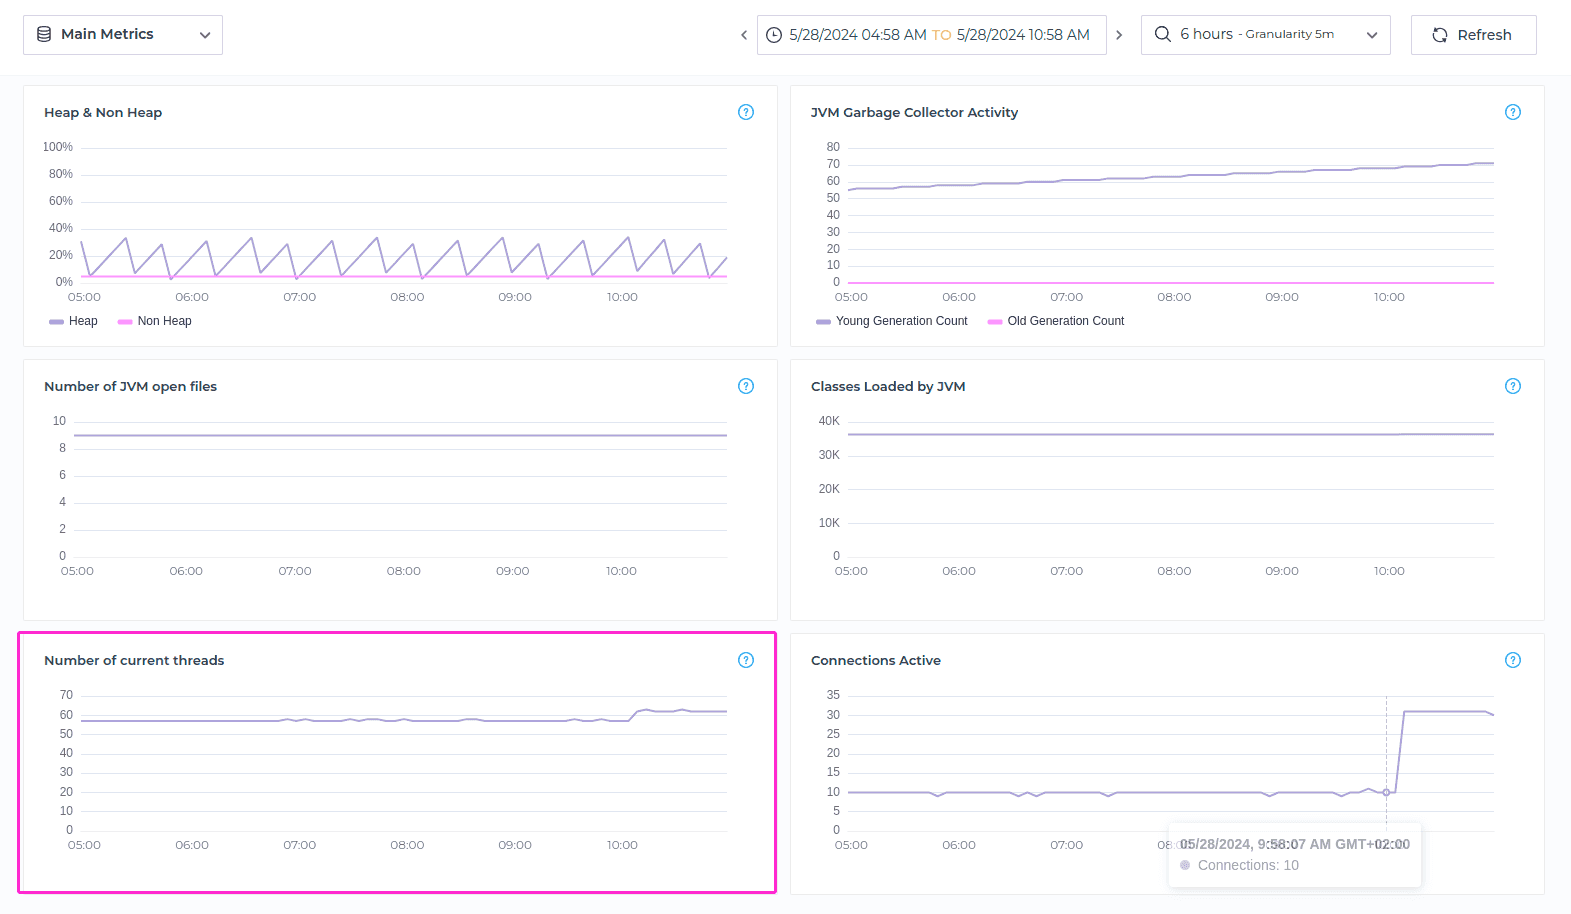
Number of current threads
The metric Number of current threads, which retrieves the current count of JVM (Java Virtual Machine) threads within a Neo4j database for the specified timeframe, provides insights into the concurrency and threading behavior of the Java processes.
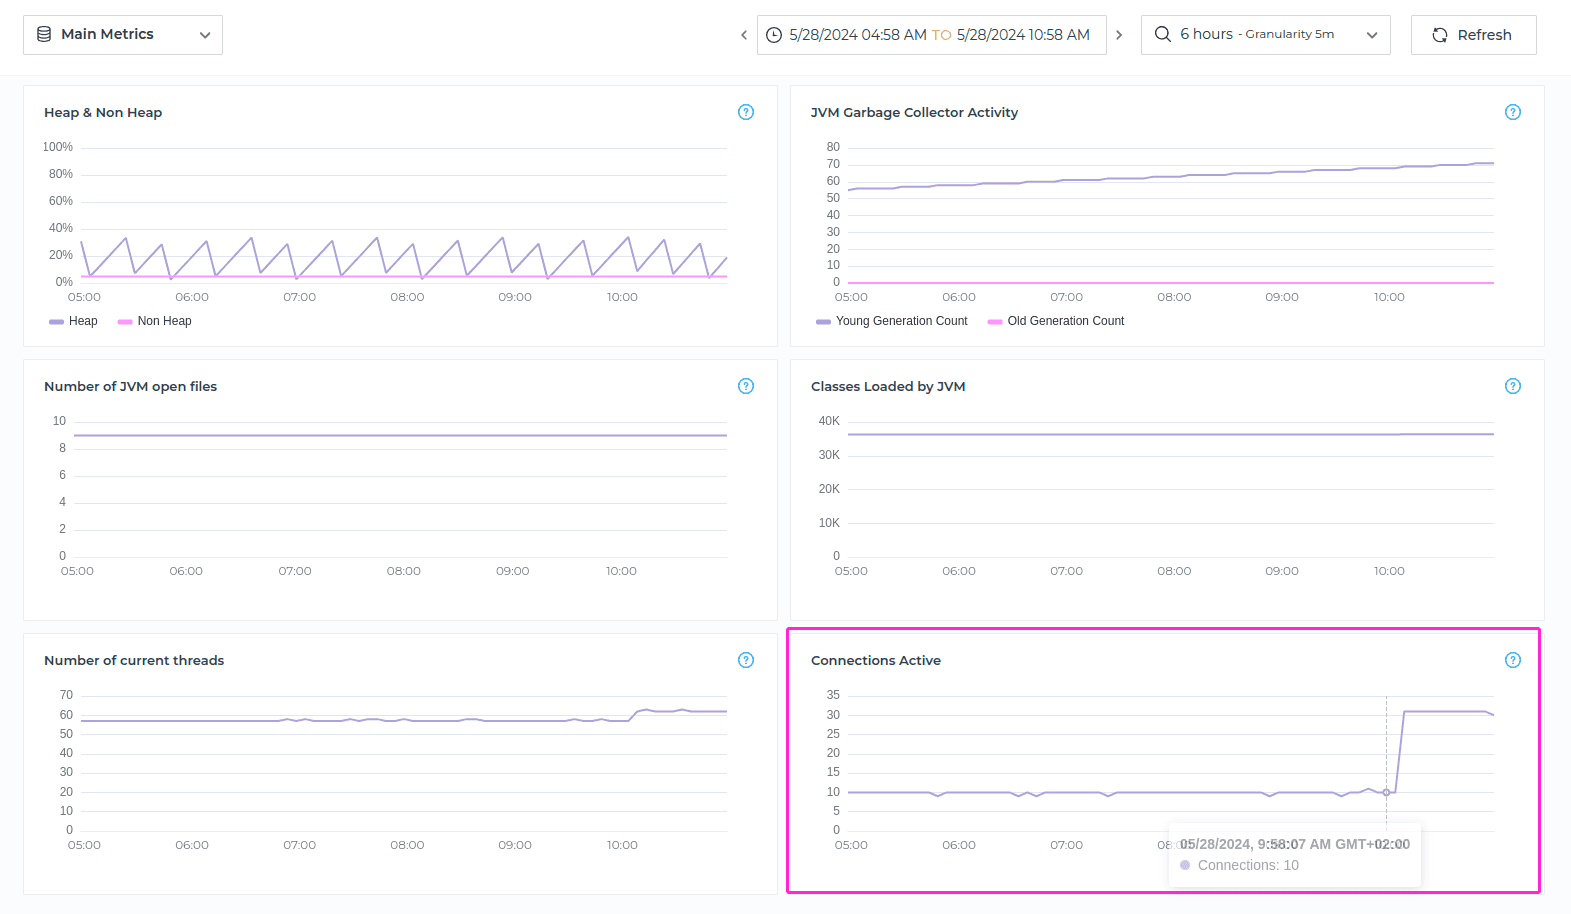
Connections Active
The metric Connections Active fetches the count of active Nginx connections in a database for the specified timeframe, and provides insights into the level of network activity and the utilization of Nginx connections within the database environment.
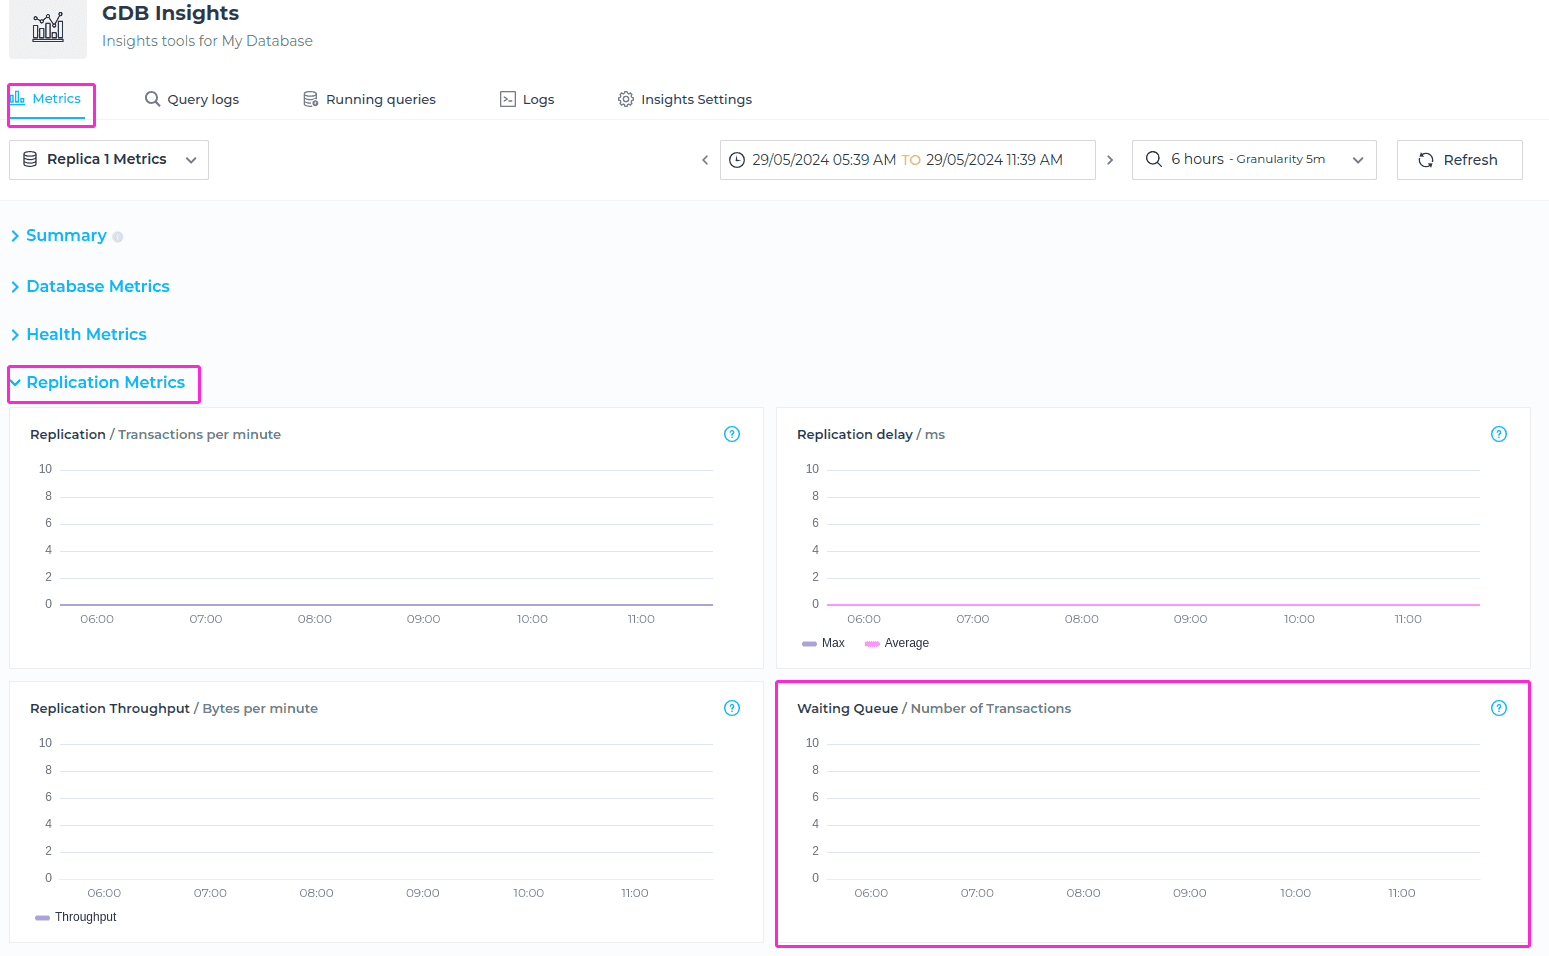
Replication metrics
The Replication Metrics are only available if you select a Replica node in the selection dropdown.
The available metrics:
- Average of transactions replicated per minute
- Average replication delay
- Average size of replicated transactions per minute
- Number of transactions in the queue to be replicated.
ℹ️ Info
Keep in mind that these metrics are available only for Read Replicas.
To locate these metrics, please switch to Replica node from the dropdown menu as shown on the screenshot below.
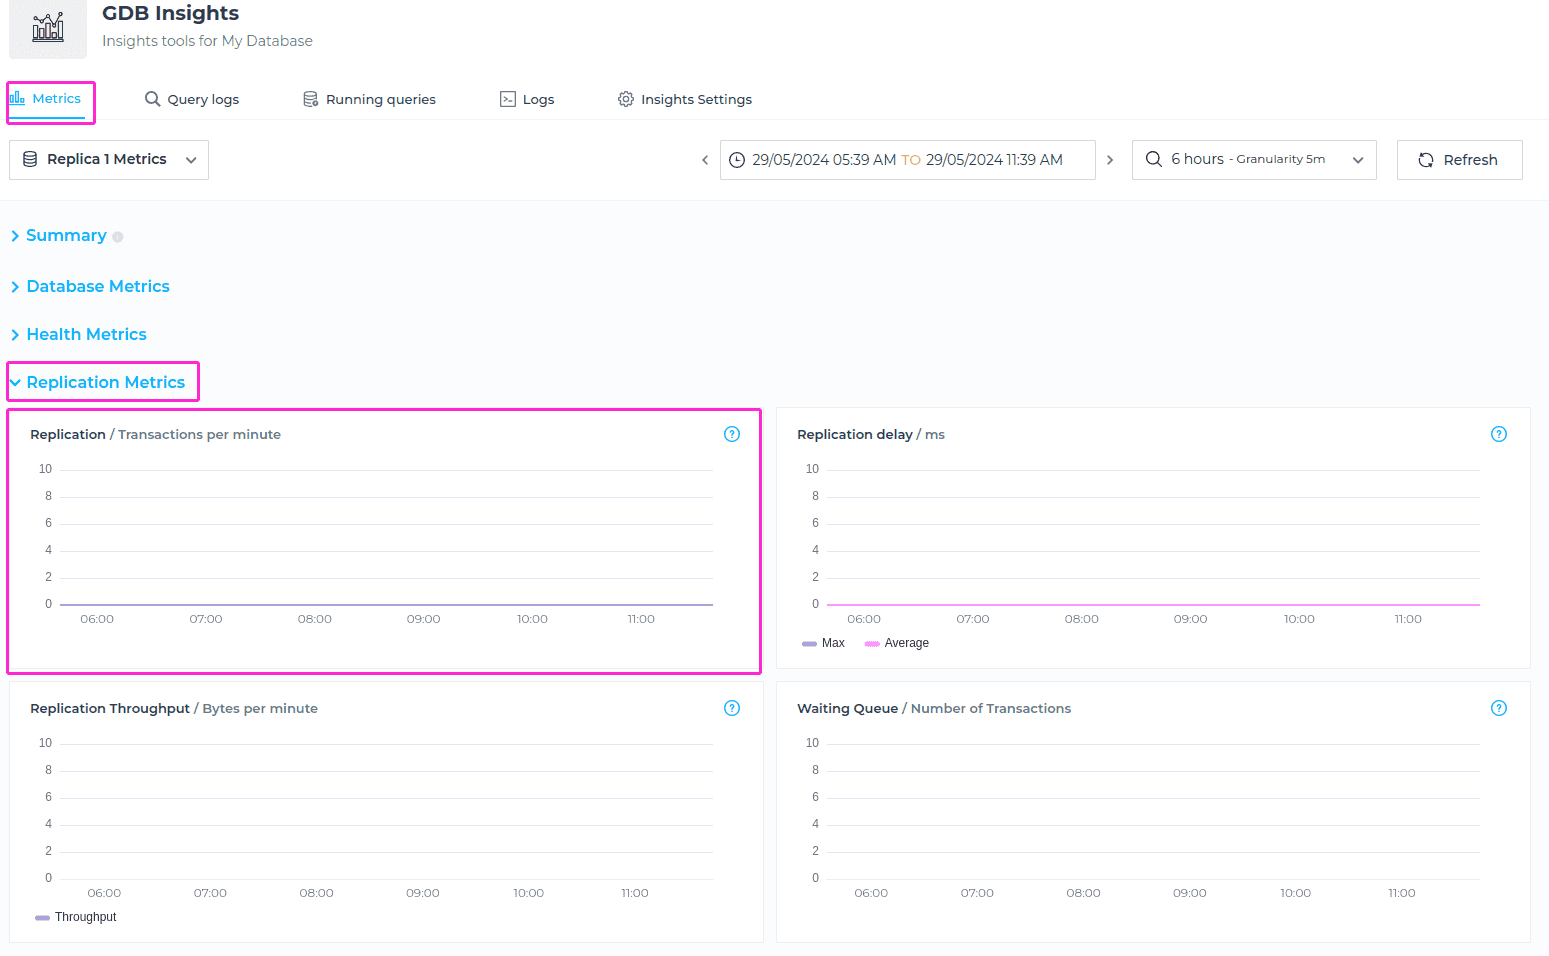
Replication
The metric Replication / Transactions per minute in a Read Replica indicates how many transactions per minute are being replicated from the primary database to the read replica for the specified timeframe. This metric reflects the frequency and speed at which data changes are propagated from the primary database to its read replica(s).
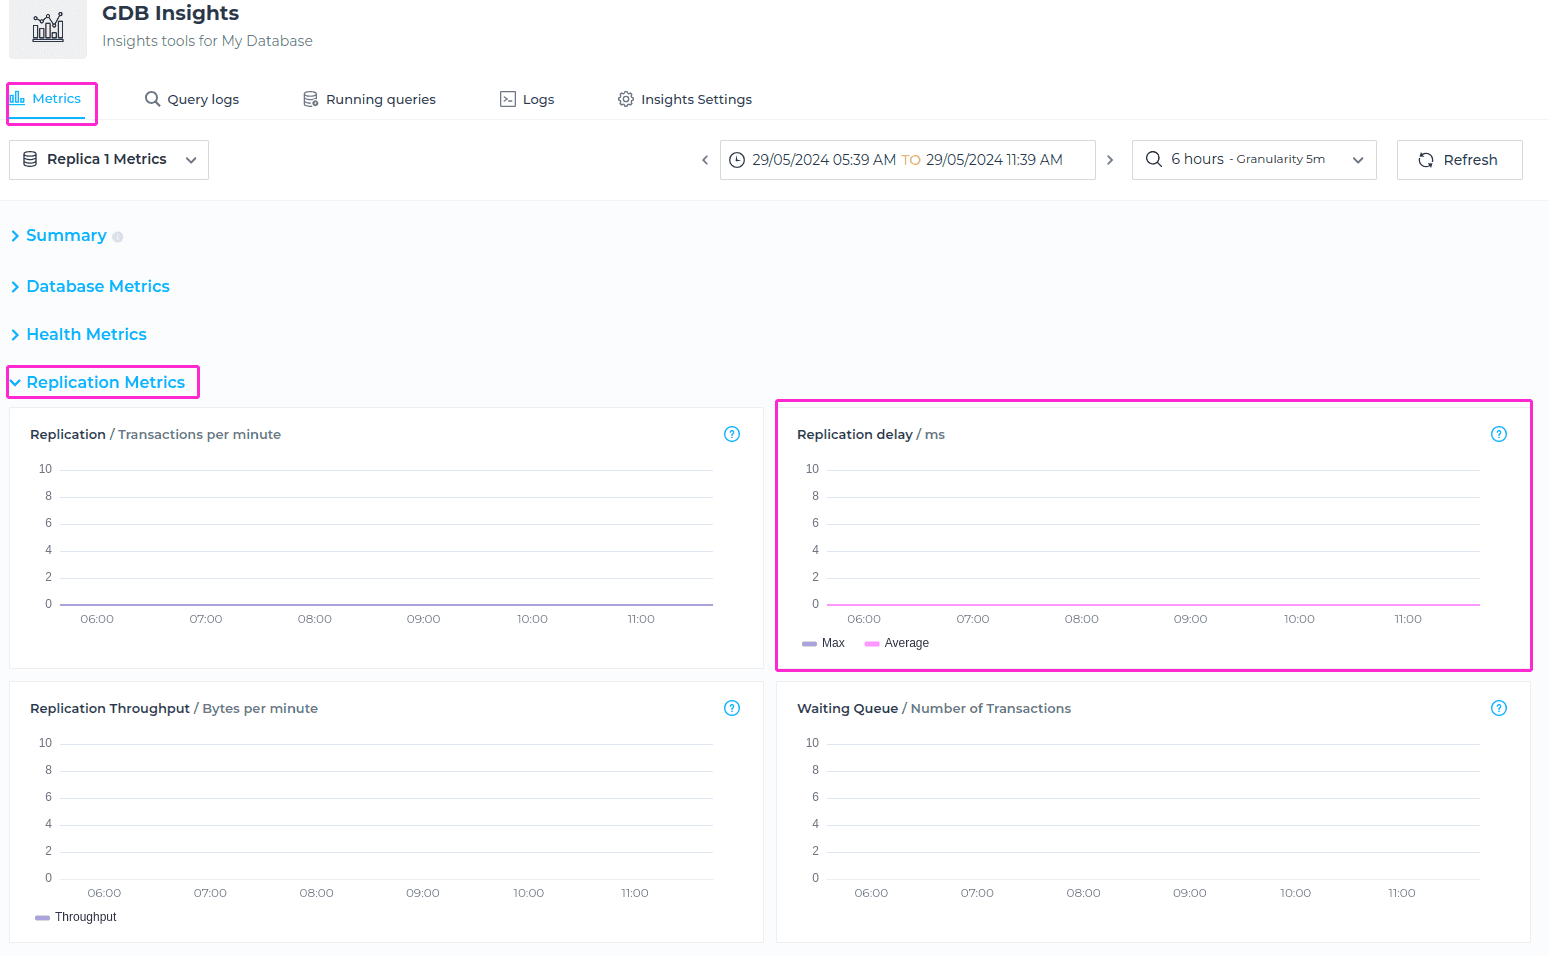
Replication delay
The metric Replication delay tells us about the time delay, measured in milliseconds (ms), between a transaction being committed on the primary database and the same transaction being replicated and applied on a read replica, for the specified time frame. It provides insights into the synchronization delay between the primary database and its read replicas.
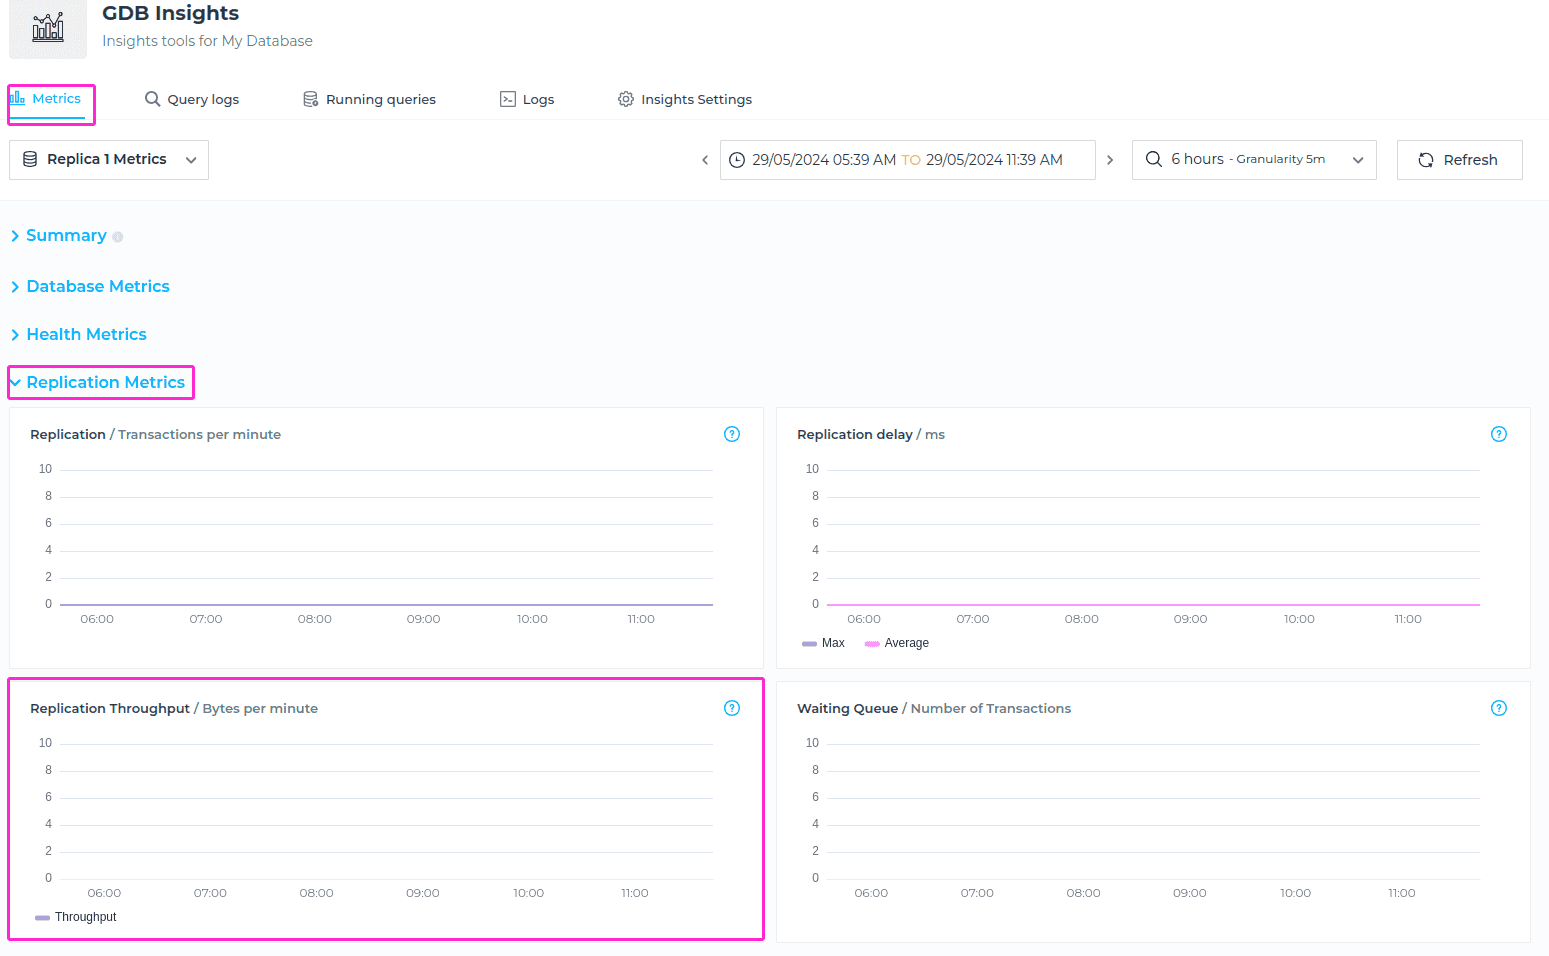
Replication Throughput
The metric Replication Throughput reflect the average amount of data, measured in bytes, that is replicated from the primary database to its read replicas within a specific time frame (per minute). It reflects the volume of data changes, transactions, updates, inserts, or modifications that are being replicated and applied to the read replicas within each minute.
Waiting Queue
The metric Waiting Queue reflect the current count of transactions that are queued up and waiting to be replicated from the primary database to its read replicas. It represents the queue or backlog of transactions that have been generated on the primary database but have not yet been replicated and applied to the read replicas.