Database Logs
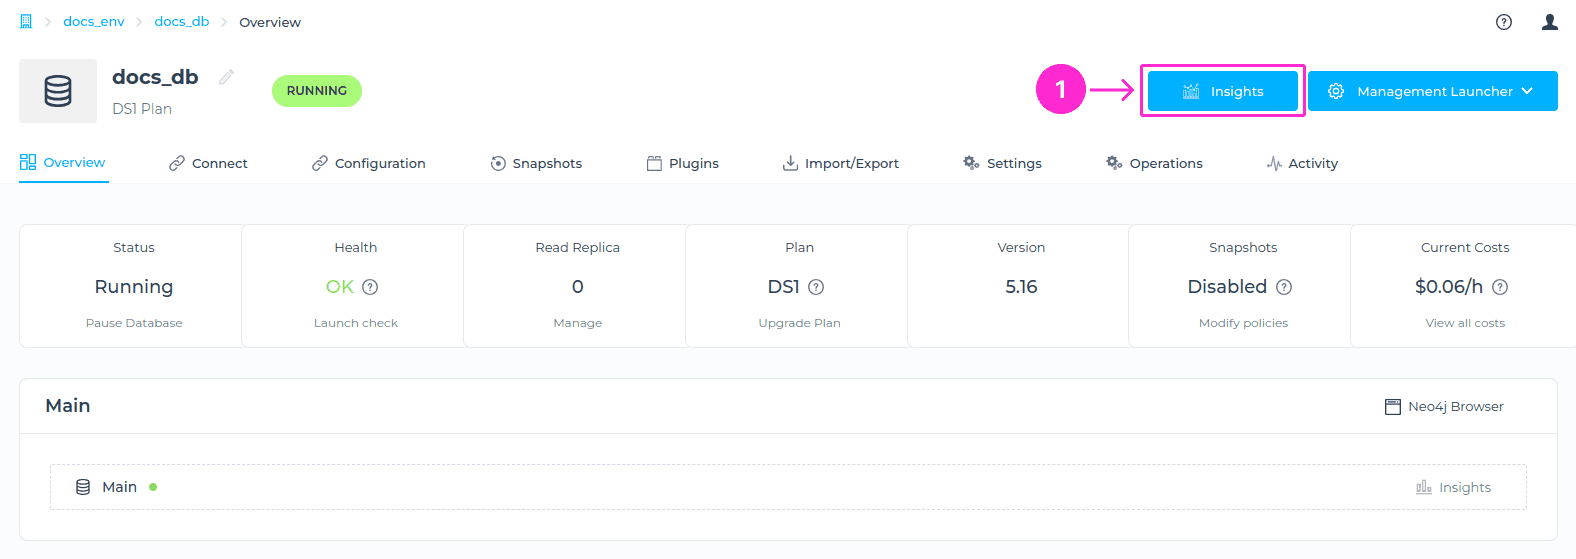
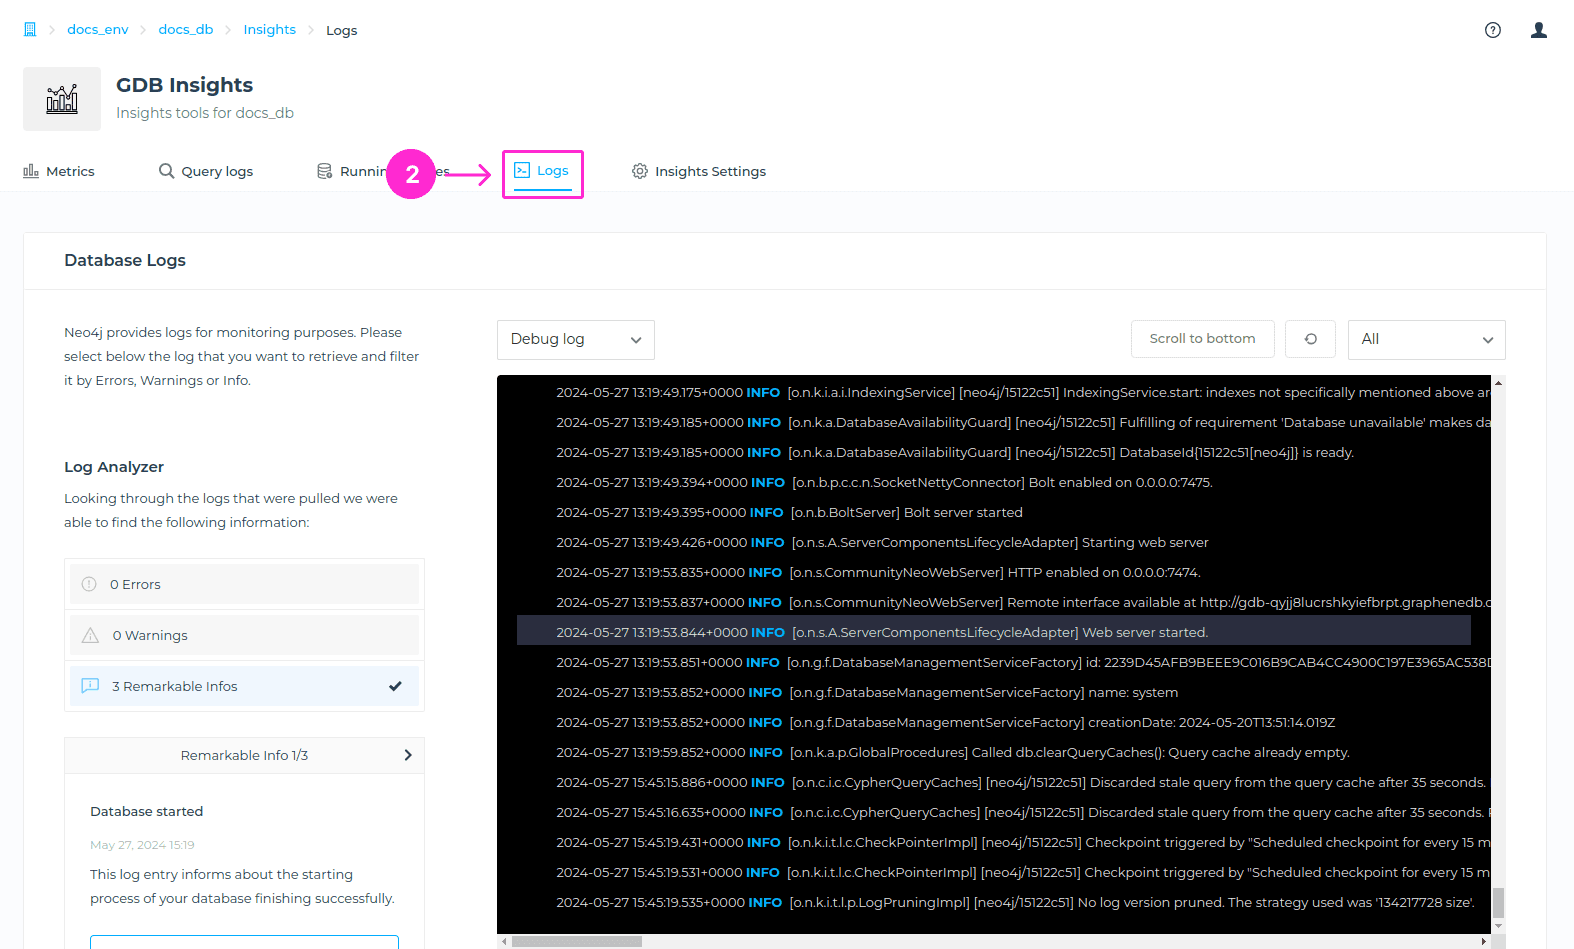
In the Insights area of the database management > Logs tab, GrapheneDB shows the logs natively provided for monitoring purposes. Logs help in identifying issues early by providing real-time insights into errors, warnings, and critical events.You’ll be able to select the log that you want to retrieve and filter it by Errors or Warnings, but also to choose to show All logs.
If the database is in a Paused state, logs are not visible. You will need to Resume your database to see the log entries.
We’ve additionally brought to you a great feature to help you with debugging and have quicker insights into what you’re looking for, and it’s called Log Analyzer.
Which logs are available to me?
| Log Type | Info |
|---|---|
| Debug log | The Neo4j debug log. It’s a log of information useful when debugging problems with Neo4j. |
| User log | The Neo4j user log, where general information about Neo4j is written. |
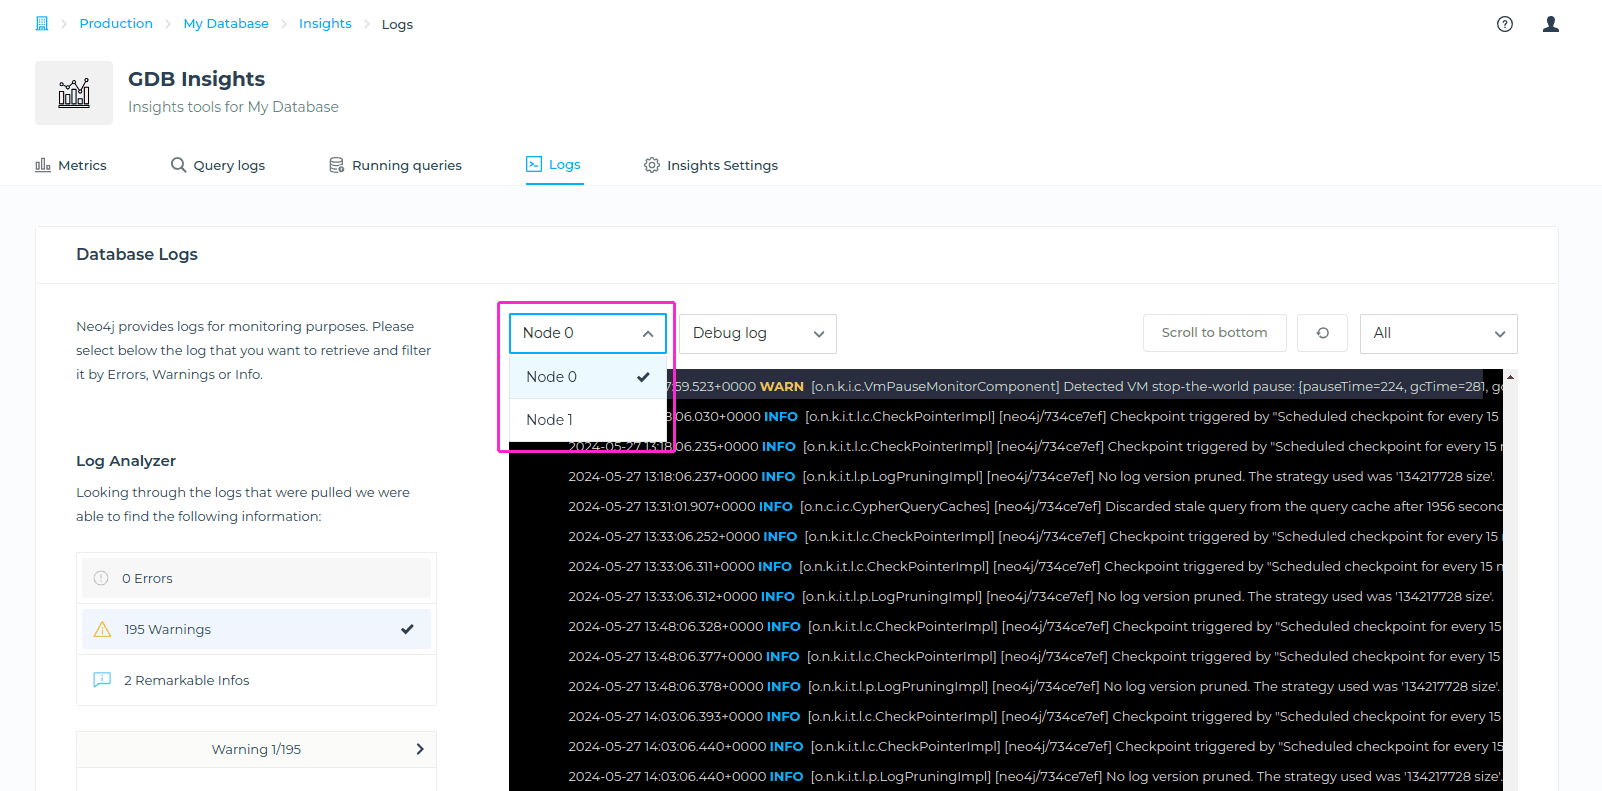
Choosing specific Node logs
When having Read Replica created, you can also check logs for it the same way as for Main Node. You just need to select the Node that you want to check logs for. Navigate to Logs tab > choose a Node from the dropdown menu.
Selecting log type
Navigate to the drop-down menu in the Logs section, and select either User log or Debug log. For each log, you can use the Scroll to bottom button to navigate to the bottom of the log, or use the Refresh button to retrieve the latest data.
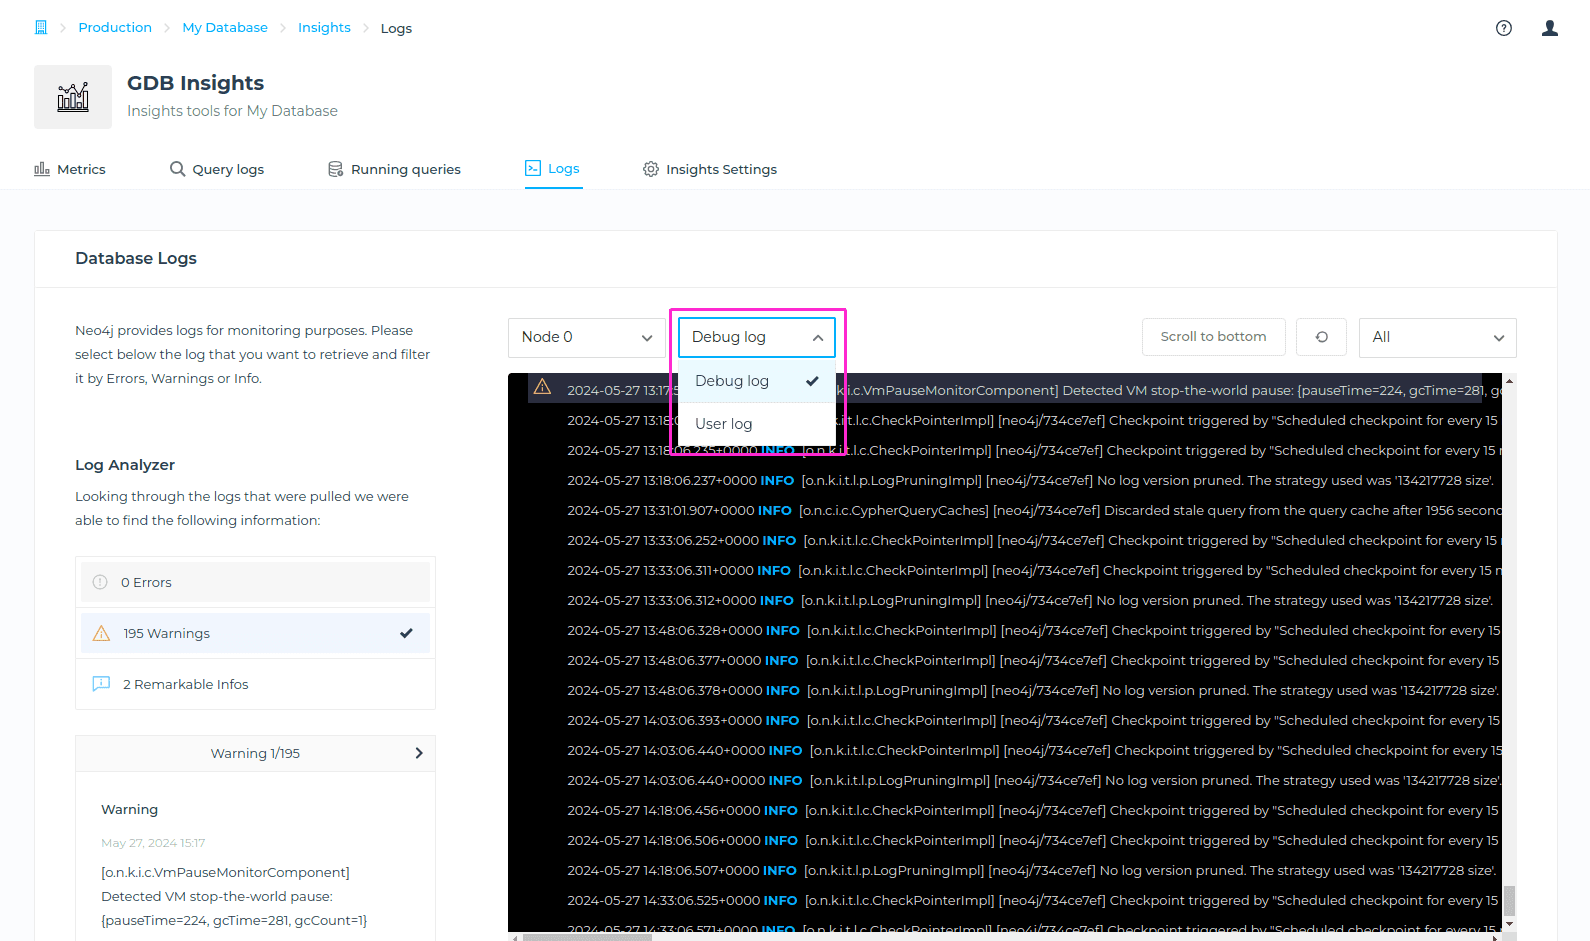
More details on these logs can be found here.
For each log, you can use the Scroll to bottom button to navigate to the bottom of the log, or use the Refresh button to retrieve the latest data.
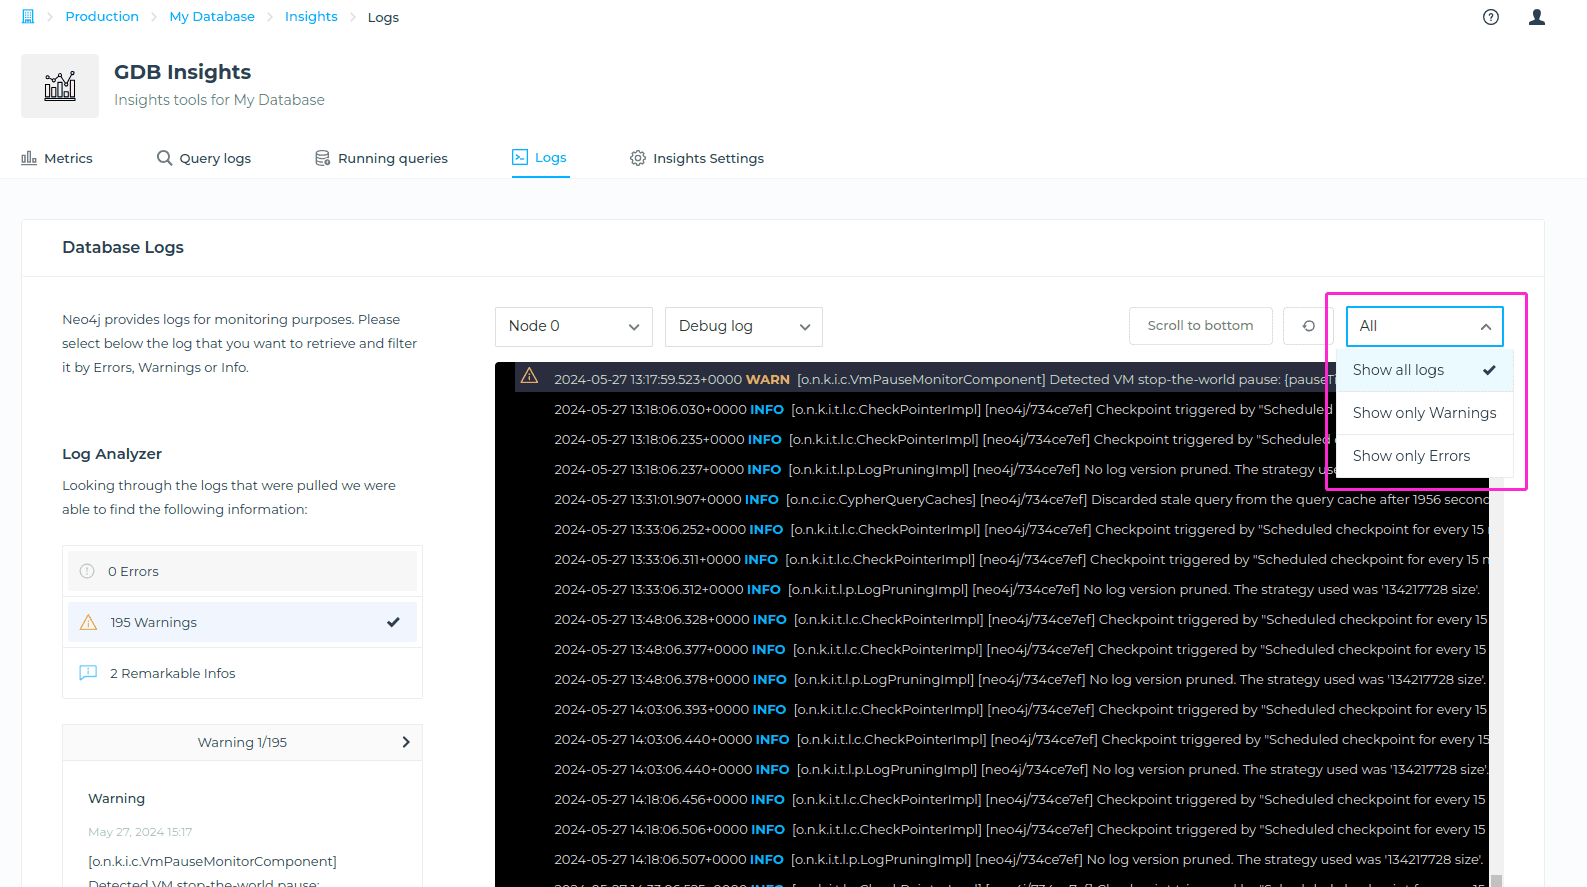
Filtering by Warnings or Errors
The below details list the messages raised by Neo4j and their severity level.
WARN: Report errors that need attention but are not severe.
ERROR: Report errors that prevent the Neo4j server from running and must be addressed immediately.
To filter the messages in log, navigate to the drop-down menu at the right-hand side, and select one of the options (Show all logs, Show only Warnings, Show only Errors). You can also use the Scroll to bottom or Refresh buttons.
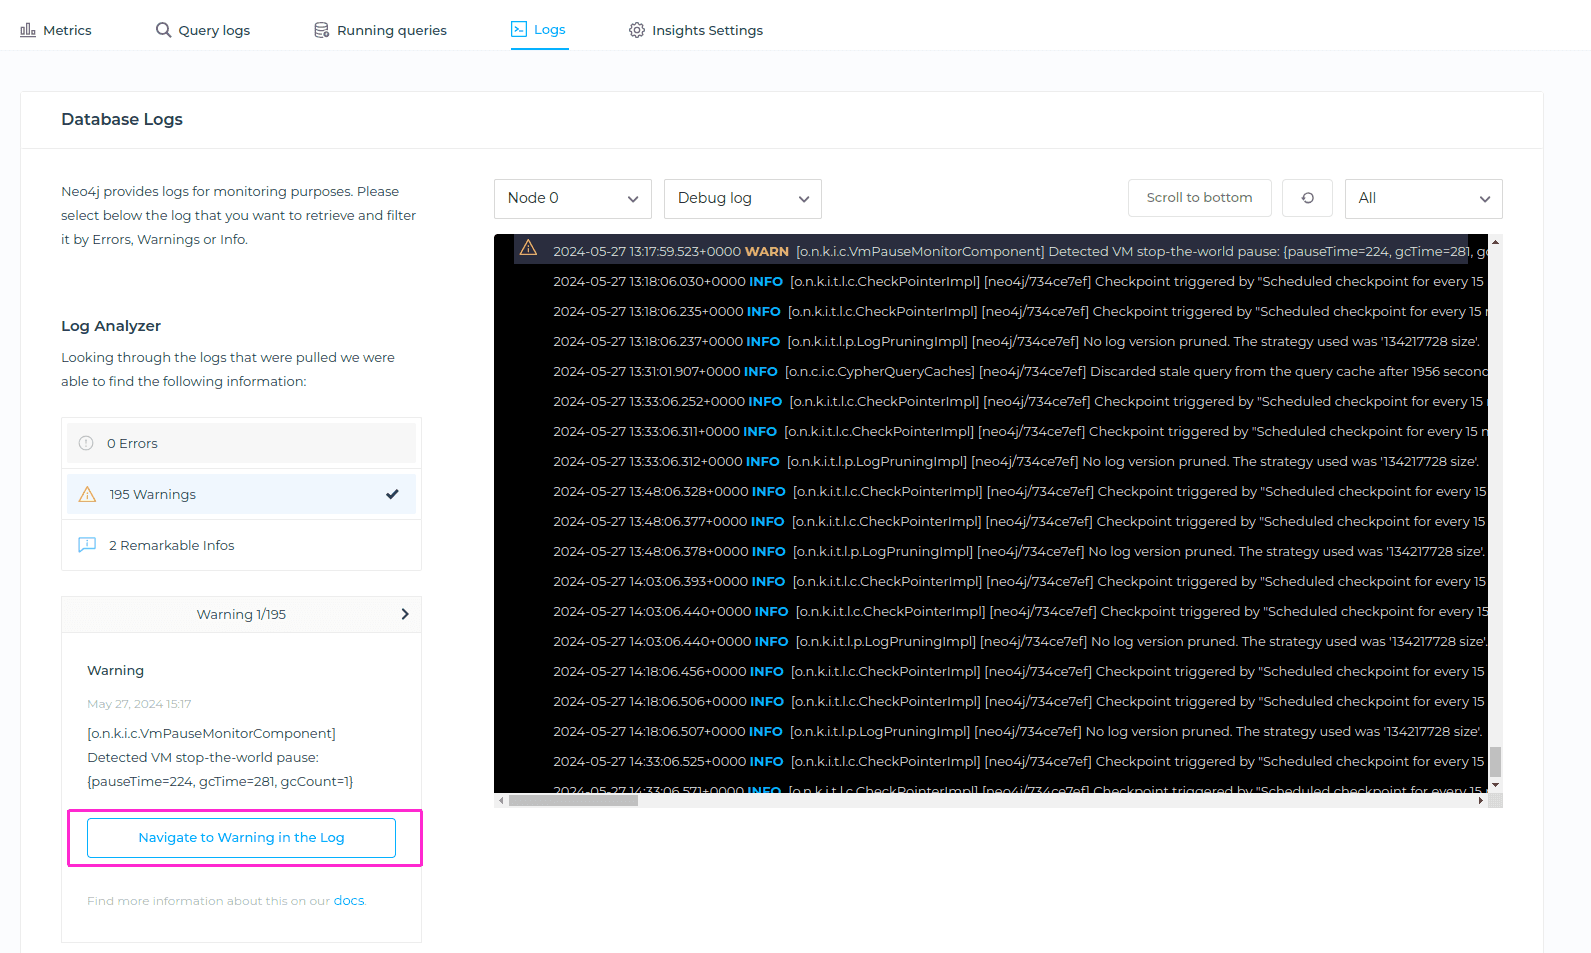
Log Analyzer
The Log Analyzer is a feature designed to help you reduce the time used in locating the most important information. Log Analyzer goes through the log that is loaded and extracts relevant information to map it to an explanation. First of all, it filters warnings, errors, and some interesting info that you can easily switch between.
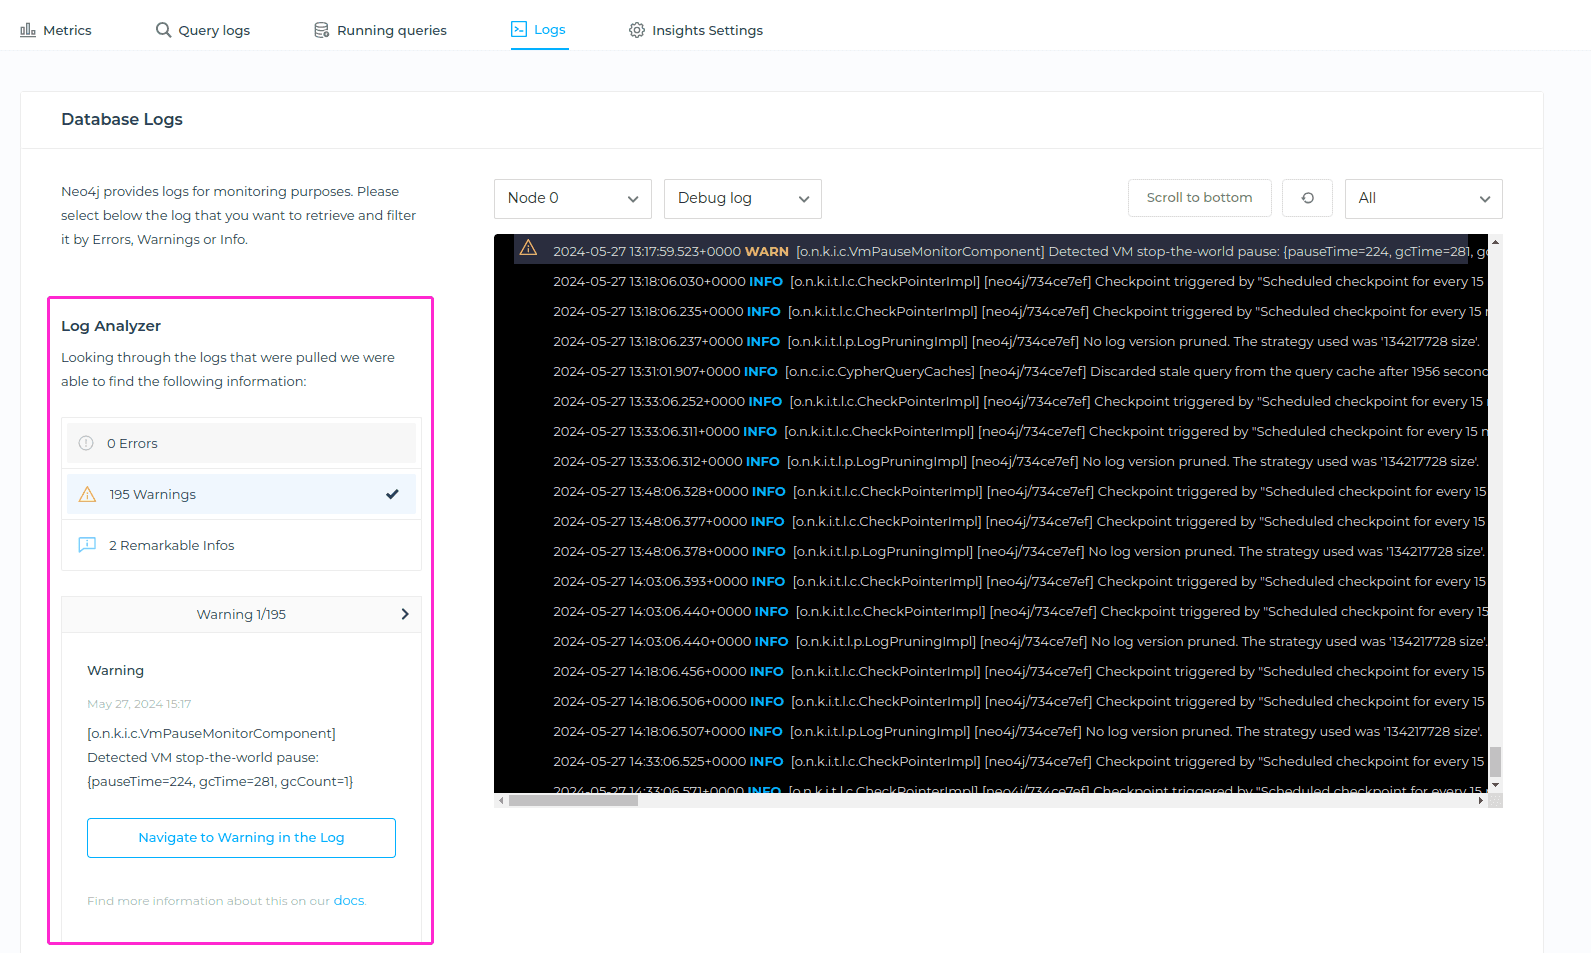
Additionally, for some logs, we offer an extended explanation related to errors, warnings or info in the log. For example, you’ll be able to see detailed explanations in an event of the database being stopped.

If you click on Navigate button, it will bring you to the exact line in the logs that this extended explanation refers to, being an error, warning, or info, depending on what you’ve selected.