Running Queries
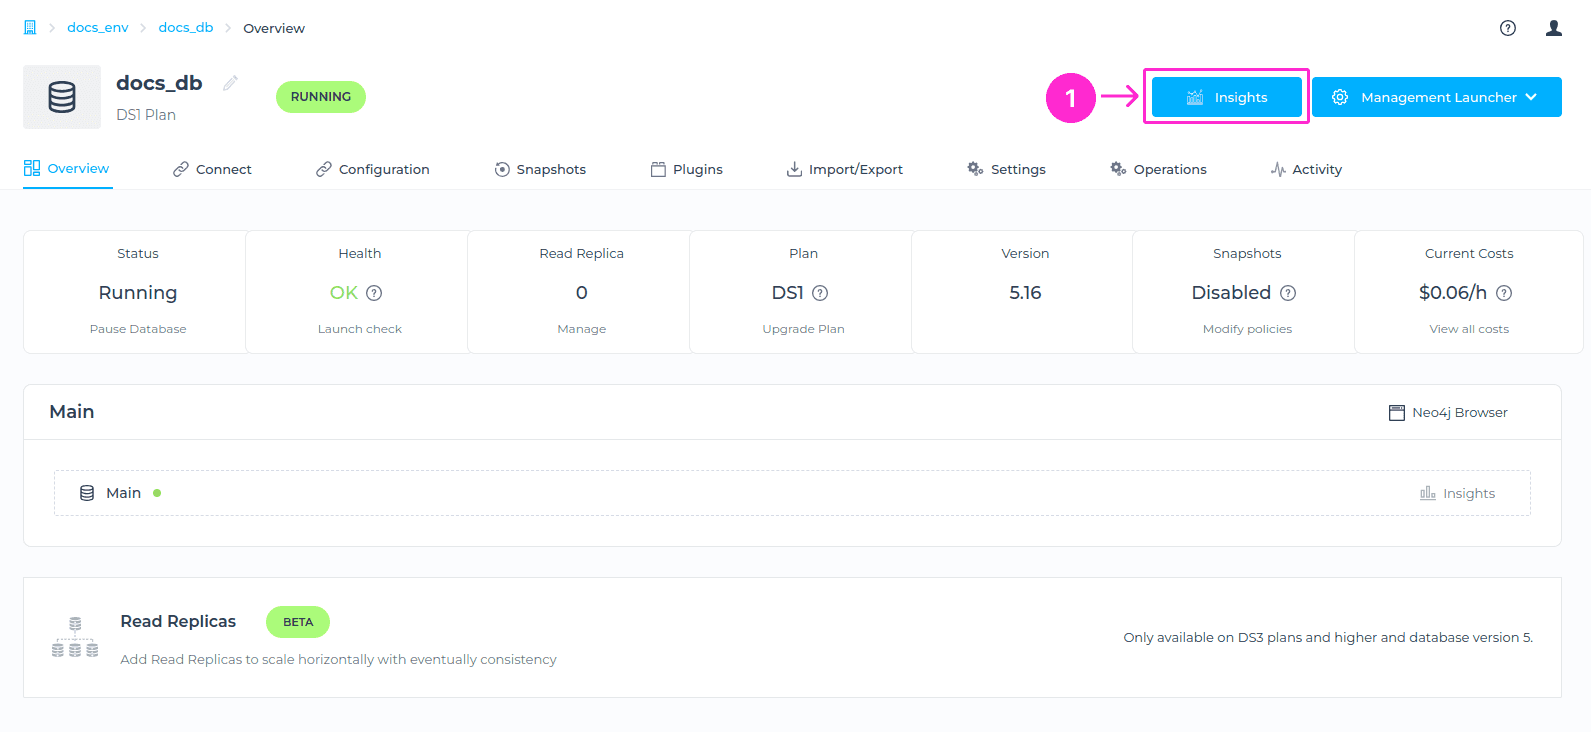
The Running Queries feature provides insights about the running queries in the selected node. To locate this information, please navigate to the Insights area > Running Queries tab.
Selecting Node
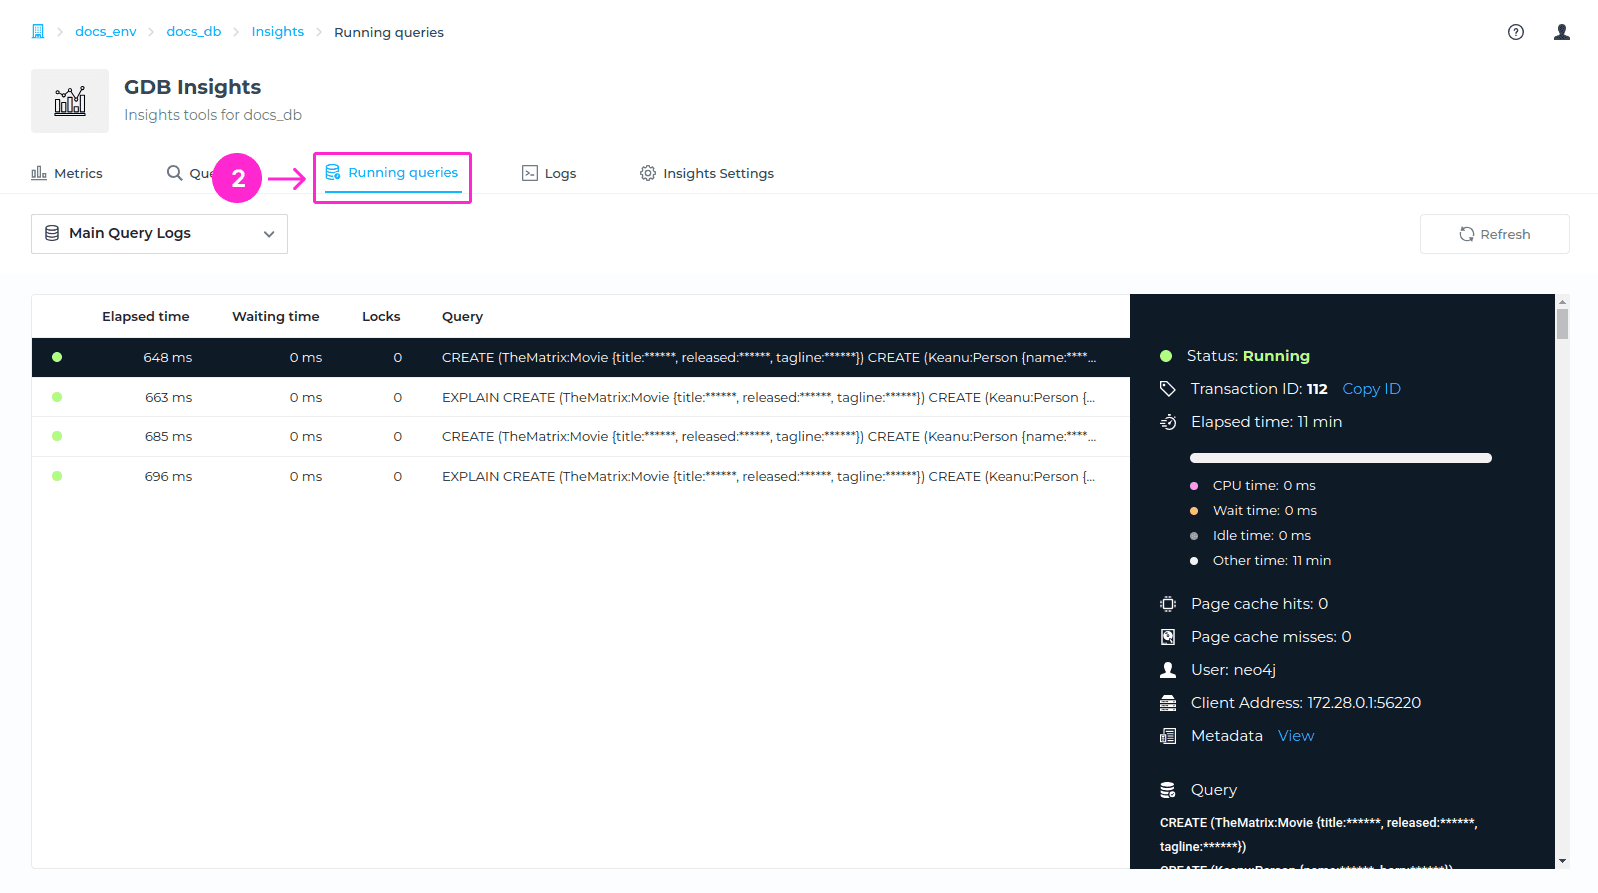
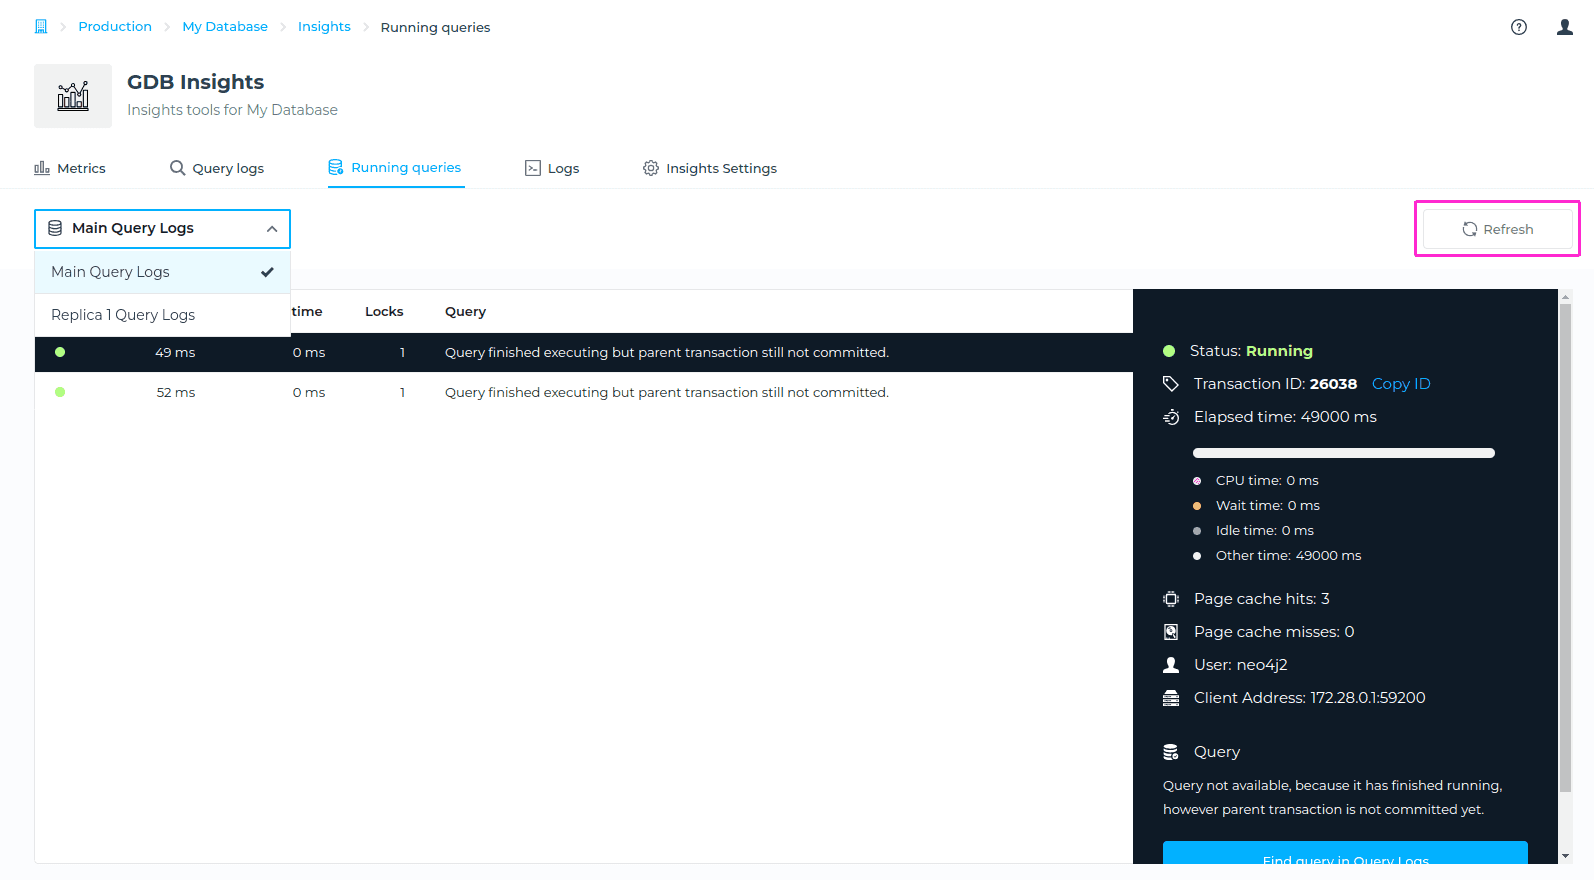
In a case that you have a Read Replica enabled, you will be able to select for which node you’d like to check Running Query logs for. You can choose from Main Query logs (The query logs related to main node), or Replica Query logs (The query logs related to Read Replica). To locate this, please navigate to Running Query Logs tab, and choose a Node from drodown menu.
You can also refresh the status anytime, by clicking on Refresh button on the right side.
Info available for each query
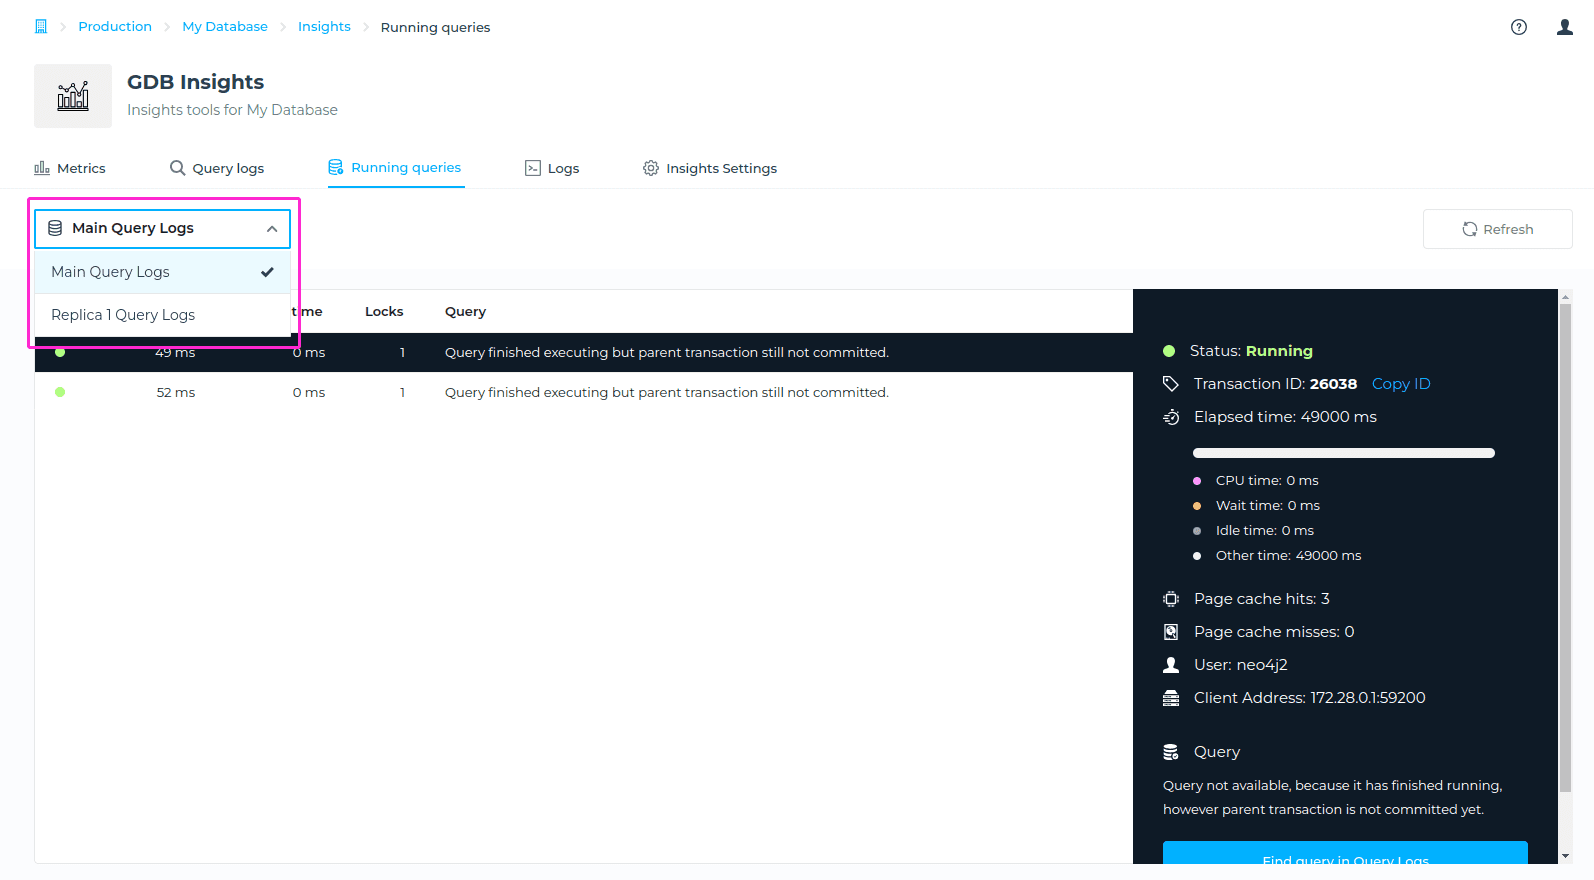
We are providing various information for each query, and you can find detailed description below.
| Item | Description |
|---|---|
| Status | Indicates that the query is currently executing. |
| Transaction ID | Identifies the transaction associated with this query. This is useful for tracking and troubleshooting. |
| Elapsed time | The total time that has passed since the query started executing. |
| CPU time | The amount of CPU time consumed by the query. A value of 0 ms suggests that the query has not yet utilized any CPU resources or the measurement has not yet been updated. |
| Wait time | Time the query has spent waiting, such as waiting for locks or other resources. A value of 0 ms means there have been no waits. |
| Idle time | Time the query has been idle. A value of 0 ms means the query has not been idle. |
| Other time | Time categorized as “other,” which could include various miscellaneous tasks. If it matches the elapsed time, it indicates that the query time is predominantly falling into this category, potentially including I/O operations or other non-CPU-bound tasks. |
| Locks | Refers to the number of locks acquired or held by a query during its execution. |
| Indexes | The number of indexes used by this query. A value of 0 indicates no indexes were used, possibly implying a full scan of nodes or relationships. |
| Page cache hits | The number of times data was found in the page cache. A value of 0 means there have been no hits in the page cache for this query. |
| Page cache misses | The number of times data was not found in the page cache, requiring a read from disk. A value of 0 suggests no page cache misses, indicating the data might not have been fetched yet or not required. |
| User | Indicates the username of the user executing the query. |
| Client Address | The IP address and port of the client issuing the query, useful for identifying where the query originated. |
| Query | Shows the details of the query and information about the current state that’s being executed. |

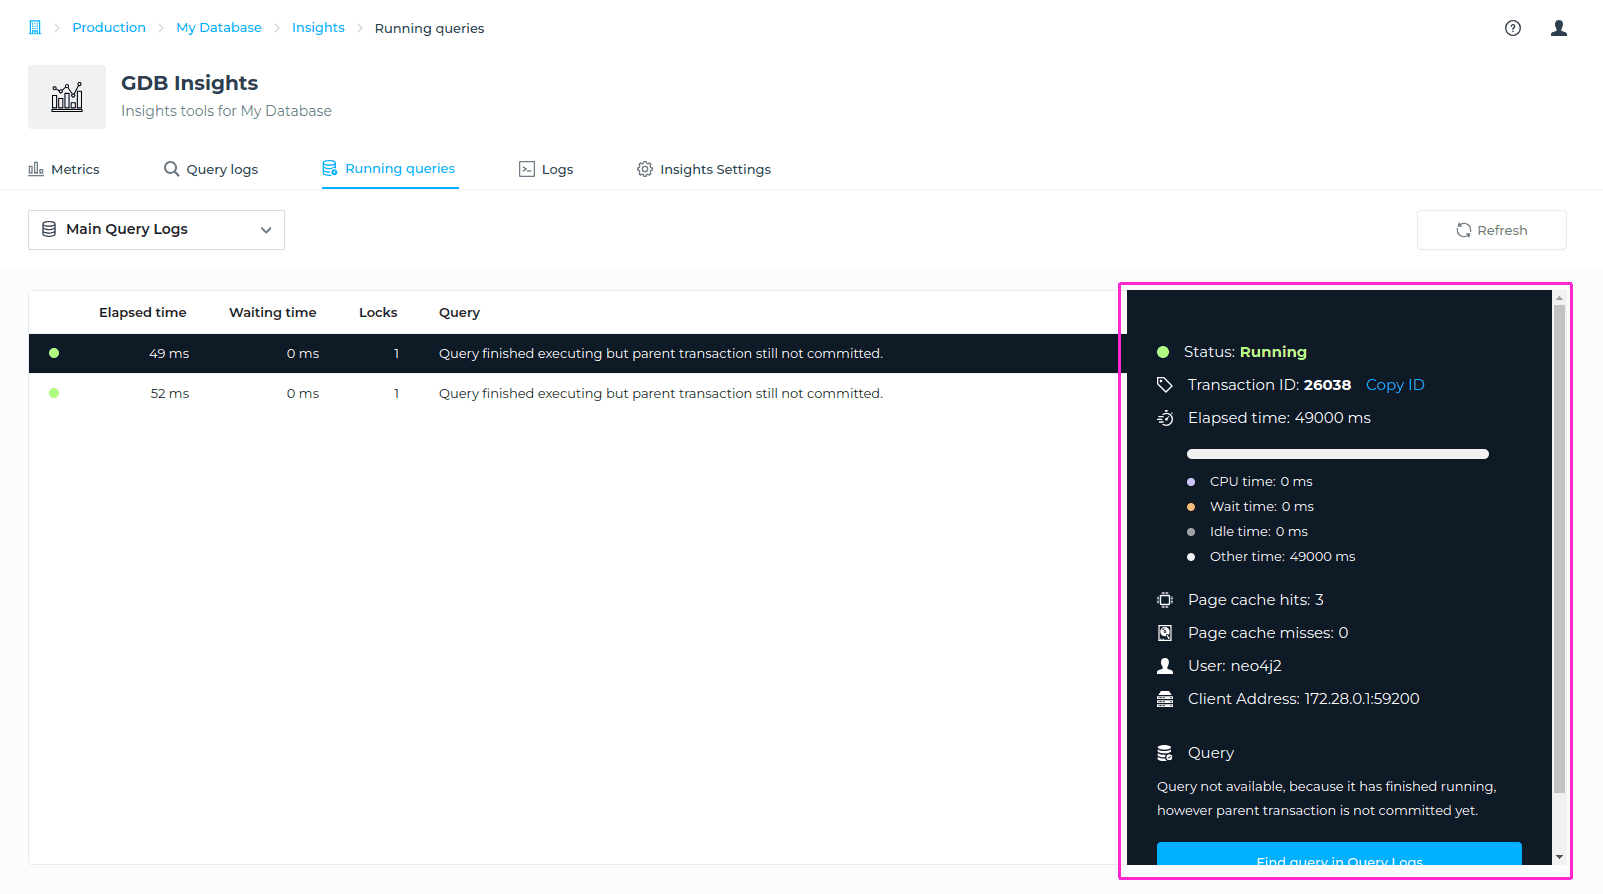
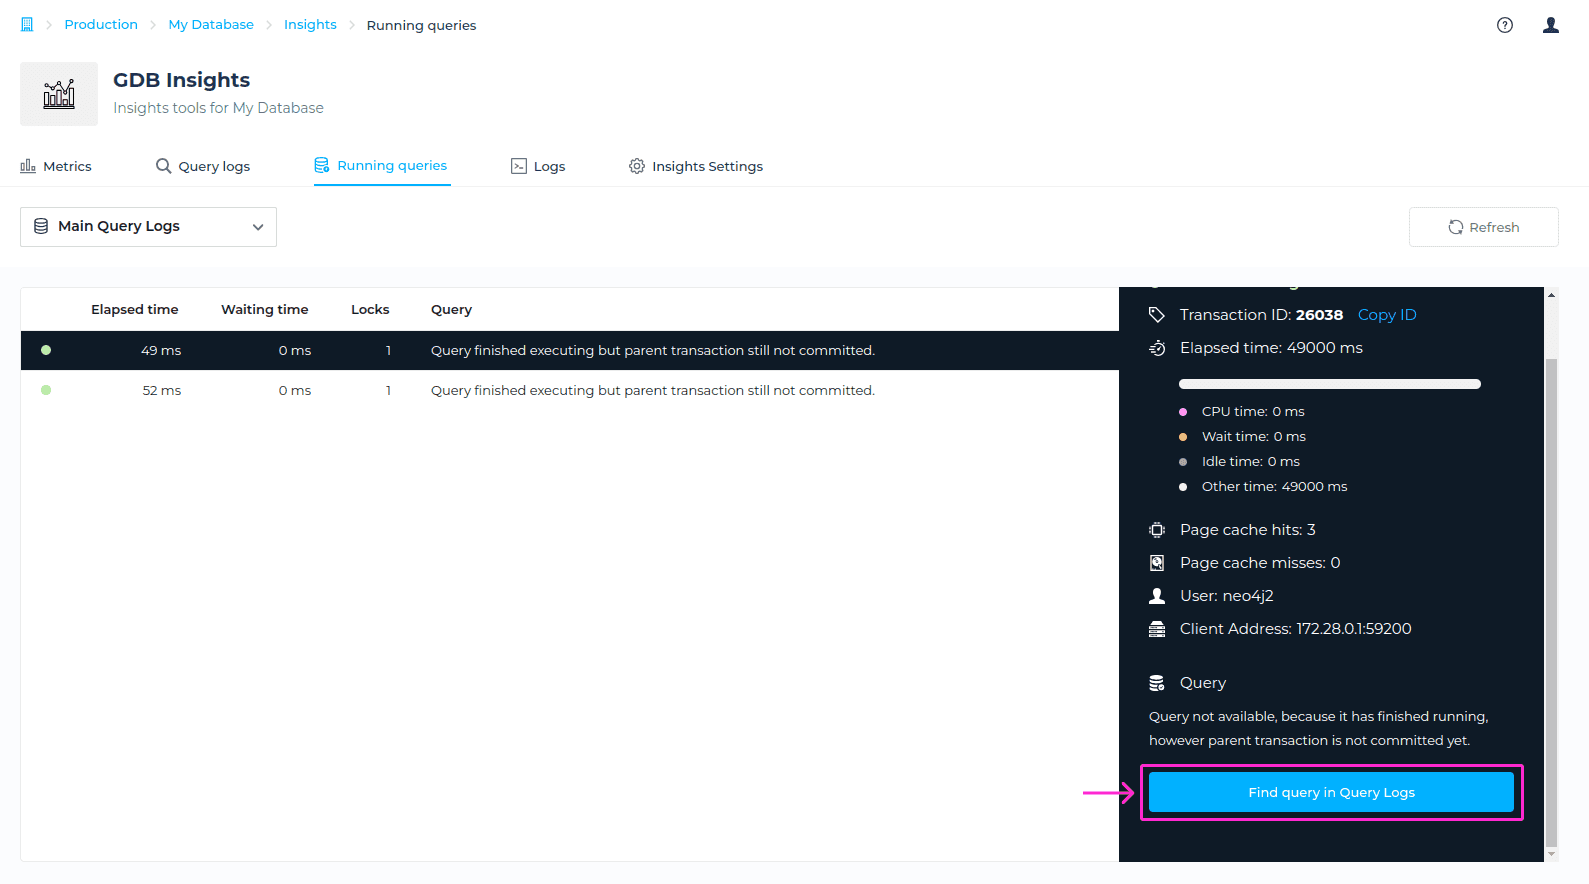
This table provides a valuable feature: a direct link to the specific query you want to examine, shown in the Query logs. By clicking the Find Query in Query Logs button at the bottom of the box, you will be redirected to the Query Logs with the ID already filtered. This allows you to immediately view the details of the specific query.