


Database Overview
In the database Overview tab, GrapheneDB provides you with a way to have a clear rundown of the overall information related to the selected database. This information is organized into two sections:
- General Info — quick status, plan, and key metrics for your database.
- Deployment Info — the nodes that make up your deployment and their recent metrics.
You can access this view by selecting the Organization > Environment where database is placed at > select the desired database > Overview tab.

General Info
The General Info section gives you a quick, at-a-glance summary of your database’s current status, plan, and key metrics.
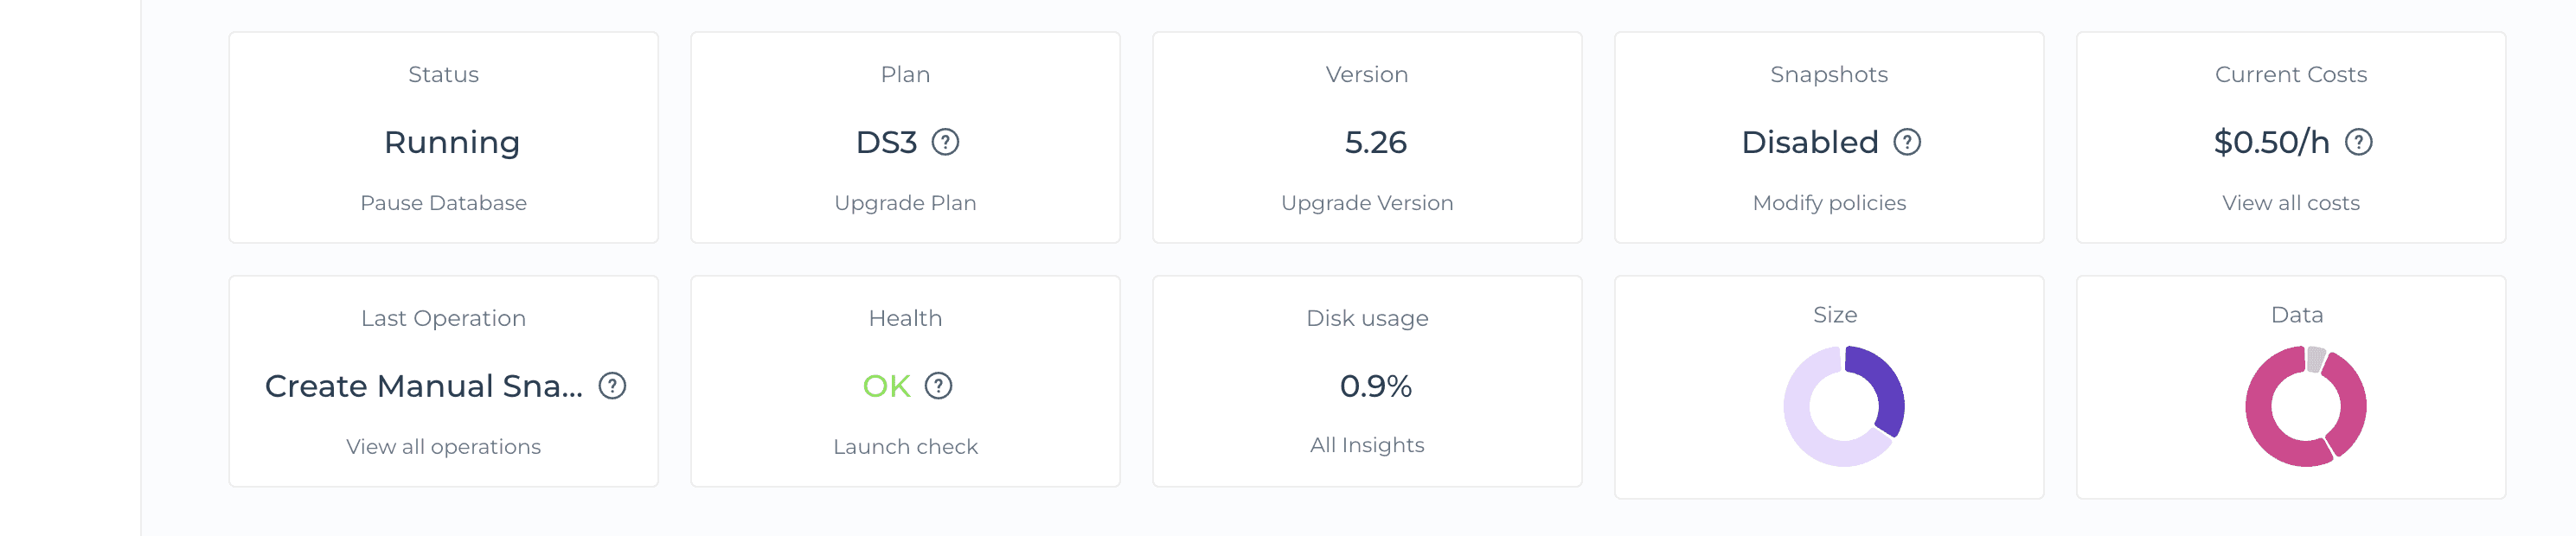
Status
Shows whether your database is currently Running. From here you can also pause it.
Plan
Shows your database’s current plan. From here you can upgrade to a different plan.
Version
Shows the Neo4j version your database is running. From here you can upgrade to a newer version.
Snapshots
Shows whether scheduled snapshots are enabled or disabled for this database. From here you can modify your snapshot policies.
Current Costs
Shows your database’s current hourly cost. From here you can view a full breakdown of all your costs.
Last Operation
Shows the most recent operation performed on the database. From here you can view the full operations history.
Health
Shows the current health status of your database — OK or Impaired — checked every 5 minutes. If it’s Impaired, you can look into server metrics, the last operation, and the Logs to check for any obvious errors or warnings. Please feel free to open a Support Case if any help is needed.
Disk usage
Shows the current percentage of disk space used. From here you can jump into all Insights for more detail.
Size
A breakdown of the total size of the disk versus the used space.
Data
A breakdown of the data distribution on disk. For example, if you have some Plugins installed, this is where that extra space usage would show up alongside your actual data. Transaction logs are also kept in the part of the dataset counted as “disk use”, rotated at 128MB, so there is always a reserved space of 128MB.
Deployment Info
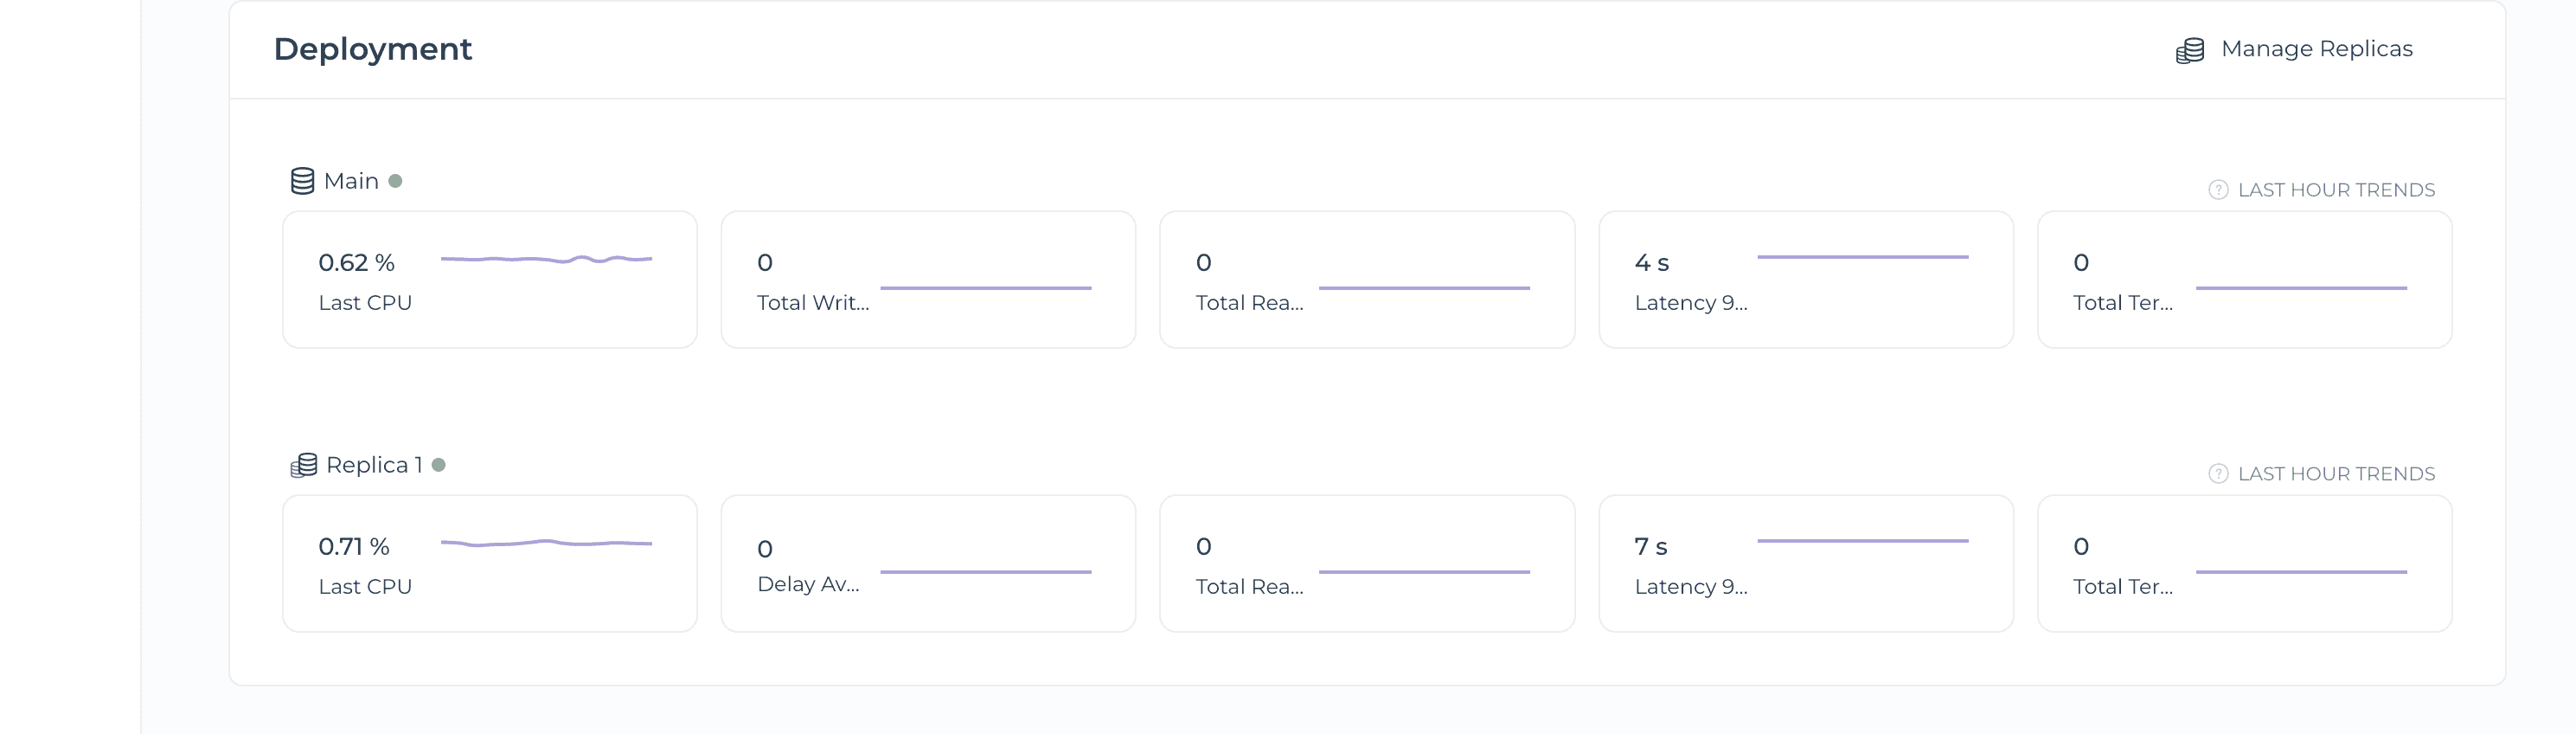
The Deployment section lists every node that’s part of your database’s deployment — the Main node plus any Read Replicas — each with a handful of key metrics, like CPU usage, throughput and latency, alongside a small sparkline showing their trend over the last hour. From here you can also jump into replica management.