


Introduction
Explorer is a query, visualization, and database management tool for Neo4j databases. It allows you to connect to GrapheneDB-managed databases as well as external databases, explore their contents, build queries visually, write Cypher directly, inspect query execution plans, and save reusable views.
Explorer provides two ways of building queries:
- Cypher Designer, a click-based, no-code interface for constructing queries visually.
- Cypher Editor, a free-form editor for writing raw Cypher.
Explorer also includes tools for inspecting database schemas, managing database users, browsing query history, and sharing saved Views with other users connected to the same database.
A View combines a query with its visualization settings, including which columns are displayed, their order, and their grouping configuration. Views can be saved and reused by anyone with access to the corresponding database.
Getting started
Launching Explorer and connecting
You can launch the Explorer from any database in your Organization. There is a button (1) in the Overview page of every database that will launch the Explorer and pre-fill the Connection URI, so you’ll only need to enter the credentials for that database. Please note that at GrapheneDB we don’t save your database credentials — you are responsible for storing and keeping them safe. Explorer does offer a database credentials management view, though, which you can use to create, modify and delete database users (see Database User management).
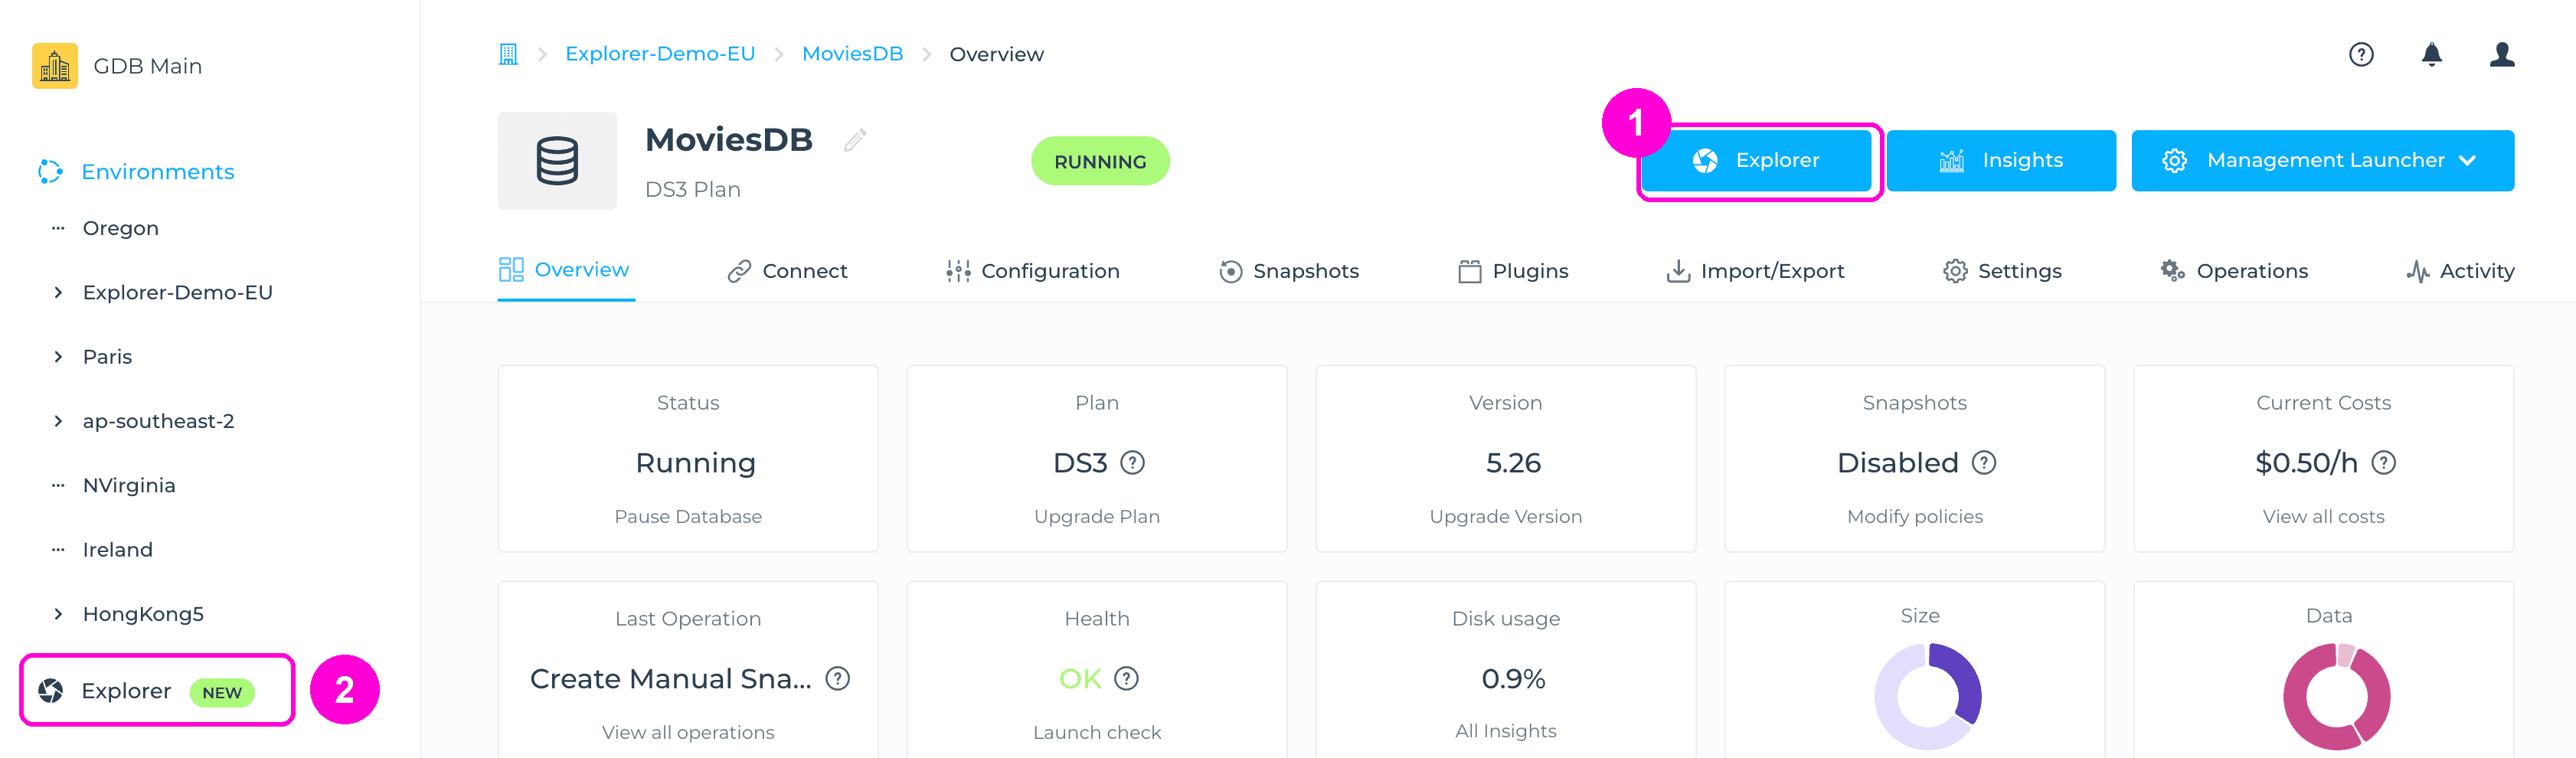
There is also a link to the Explorer in the sidebar (2), always present, which opens the Explorer without any database pre-selected.
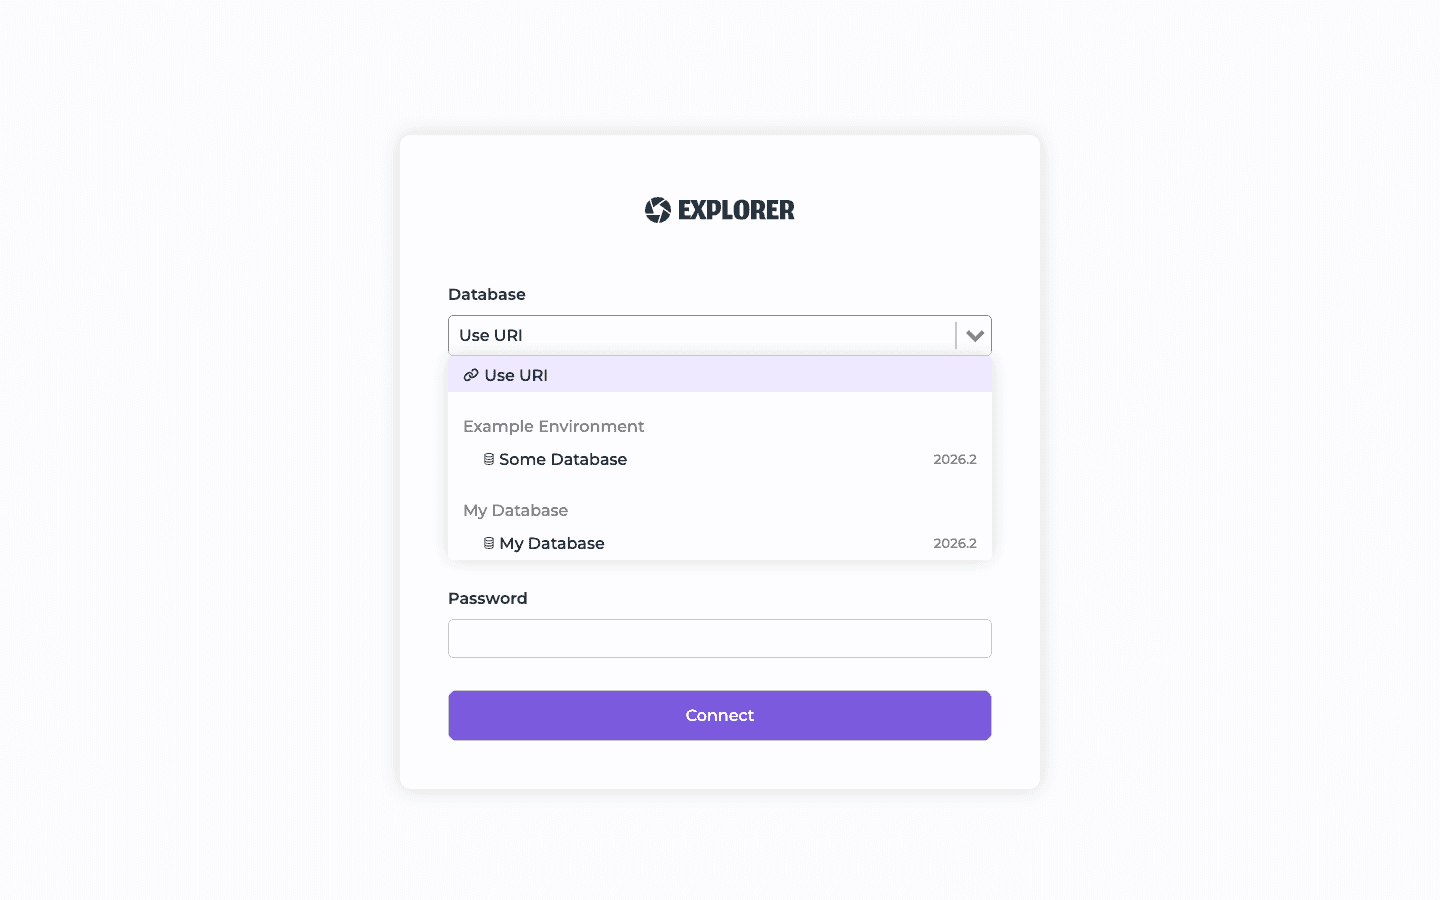
Once Explorer is open, use the dropdown to pick any database in your Organization and enter its credentials, or choose the “Use URI” option to connect to any external database by supplying its Bolt URI and credentials directly.
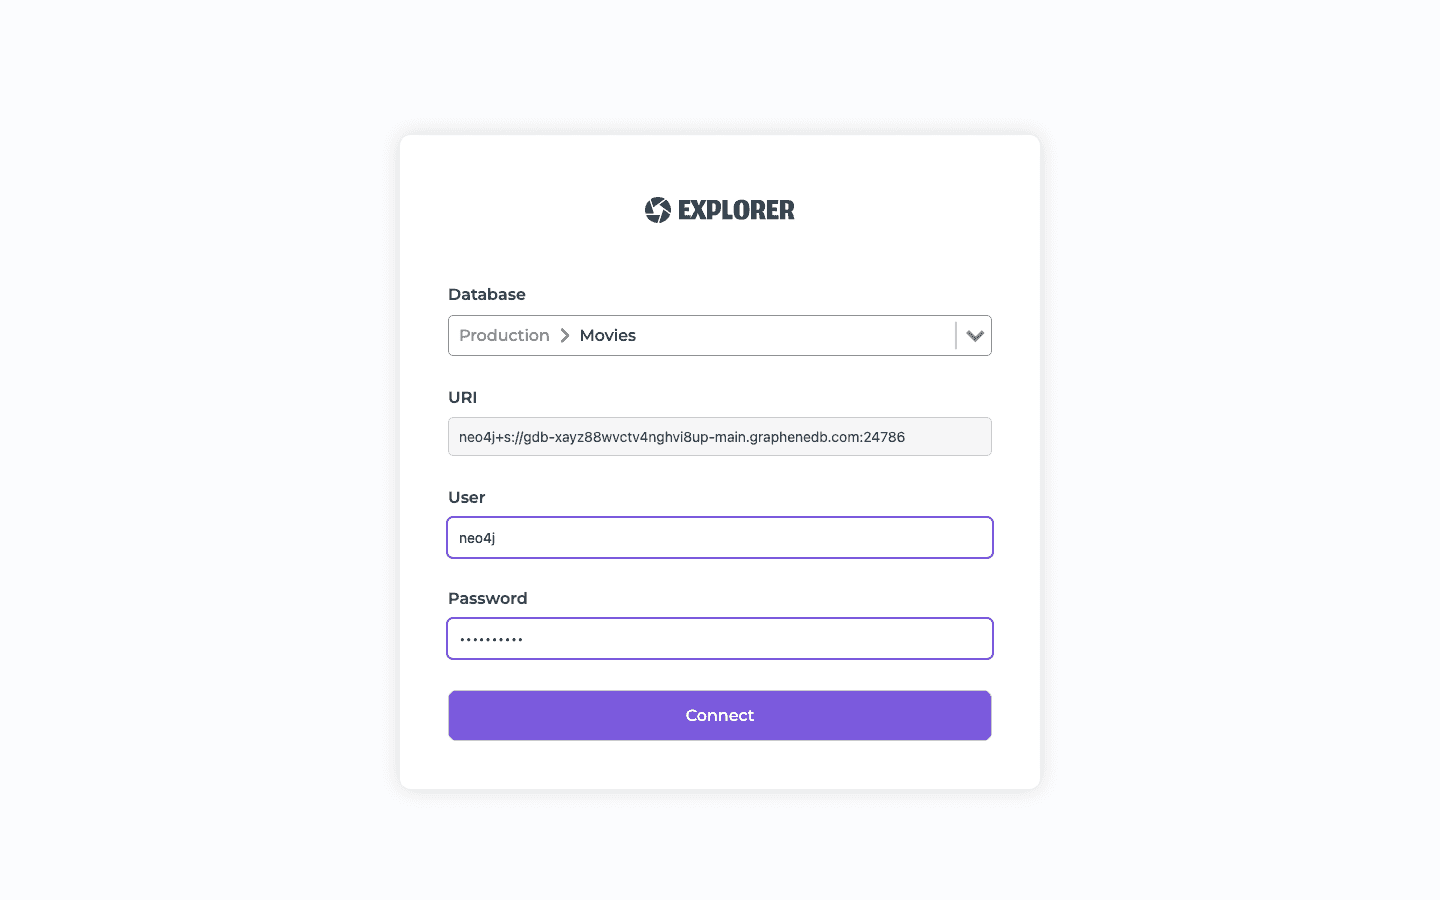
When you pick a database from an environment instead of “Use URI”, the Connection URI field is pre-filled and locked — you only need to enter the username and password:
Explorer holds a single active connection at a time — connecting to a different database, or logging out (“Close session” in the top bar), disconnects the current one. If your credentials expire, Explorer will prompt you to set a new password rather than simply failing to connect.
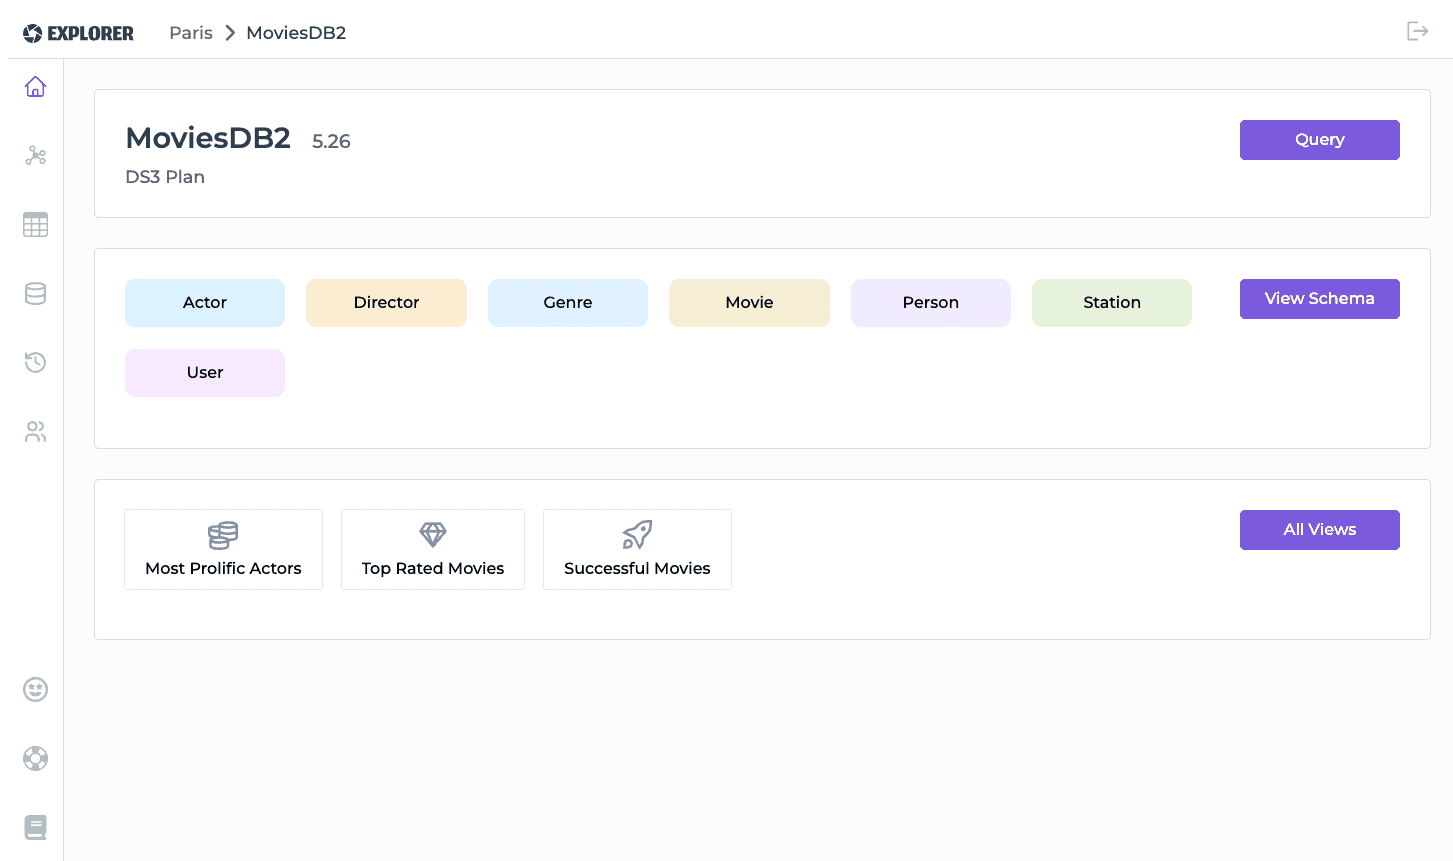
Once connected, the Home page shows the database name, version and plan, all the node labels found in it, a shortcut into the Query view, and your saved Views:
Connecting to a GDB database for the first time
If you’re connecting to a newly-provisioned database for the first time, use the default credentials — username and password both neo4j — to log in. After clicking Connect, Explorer will detect that this is a temporary password and prompt you with a new form to set your own password before continuing.
Test database
Every Explorer instance gives you access to a shared Sample Database so you can try out Explorer without connecting one of your own. Select it from the “Database” dropdown on the connect screen, under Provided Examples — no credentials needed.
The Sample Database is read-only, and persistent features — saved Views and per-label visualization settings — are disabled on it. It’s also shared by every GrapheneDB customer, so you may occasionally see slower response times, especially for more demanding queries.
Querying the database
Querying the database is the main feature of the Explorer. You can launch it from the sidebar or from the Home page. There are 2 modes:
- Cypher Designer
- Cypher Editor
Cypher Designer
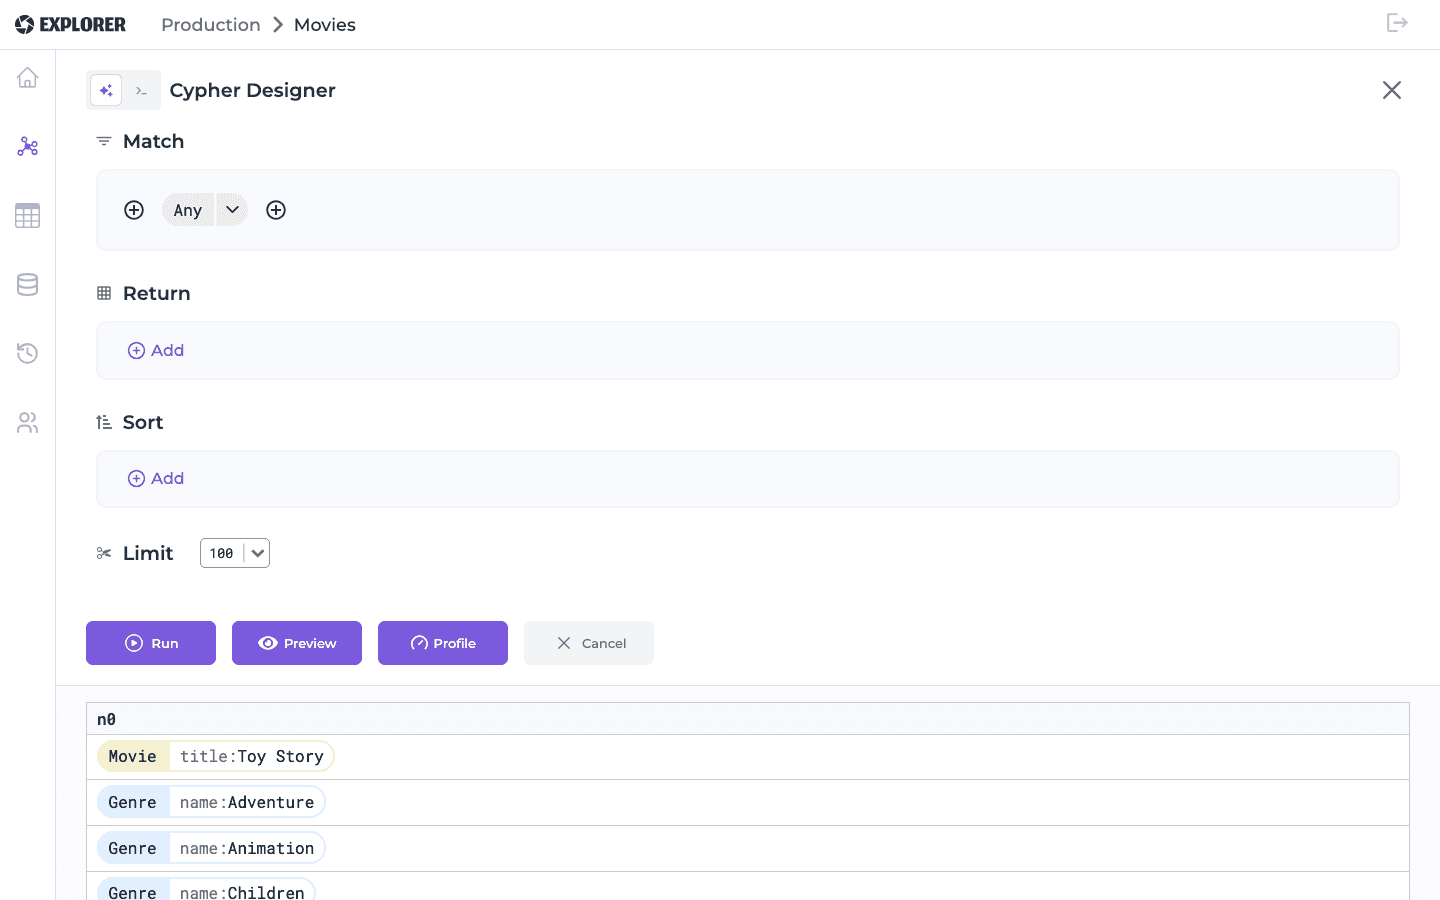
The Cypher Designer is a click-based system to query the database without having to know the Cypher language. It’s split into 4 sections:
- Match, where you build the path to filter the data
- Return, to choose which values are displayed in the results
- Sort, to choose the order of the results
- Limit, to cap how many results are returned
Match section
In this section you build the path you want to filter. Nodes are represented as rectangles with round borders, and relationships as rectangles with square borders. Arrows show the direction of a relationship.
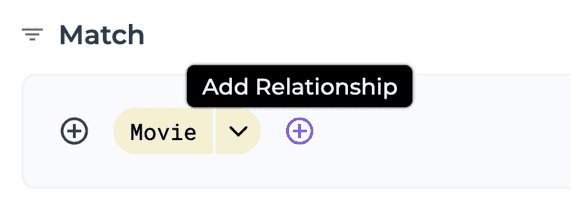
Add/Remove a relationship You can always add or remove a relationship from the path. To add a new relationship, click the plus icon to the left or right of a node:
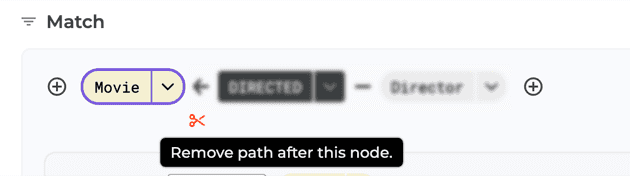
To remove a relationship — or the rest of the path from that point on — click the node or relationship where you want to cut the path; this reveals a scissors icon you can click to remove it, which also cleans up any Return/Sort fields that referenced the removed nodes or relationships.
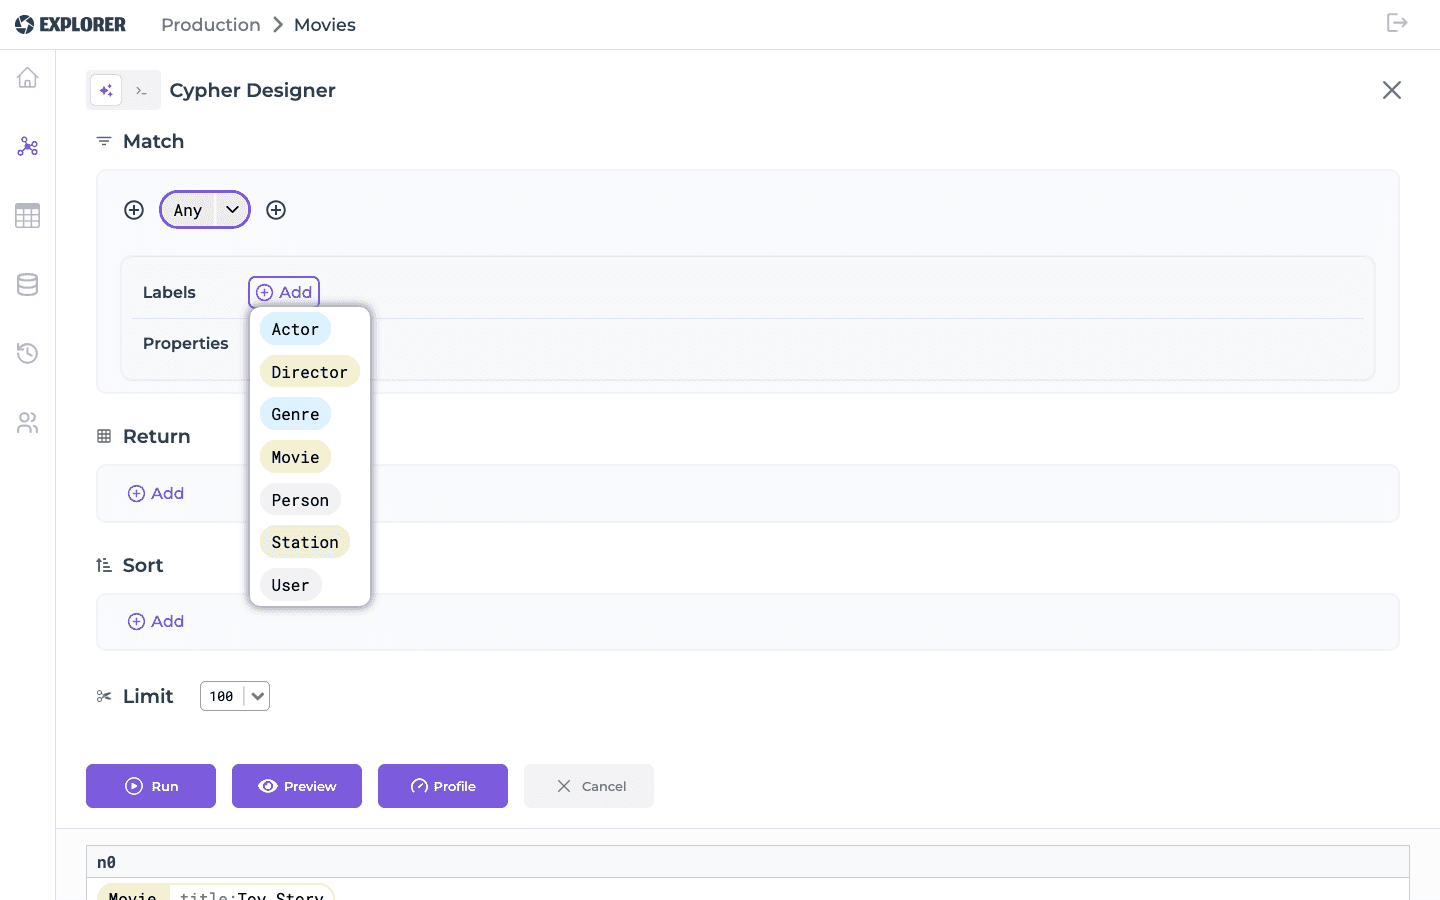
Selecting labels / relationship types Clicking a node or relationship selects it and expands an editor below the path where you can add or remove labels (for nodes) — each with an “IS” / “IS NOT” toggle — or narrow a relationship to a specific type. Right-clicking a node/relationship, or clicking directly on one of its label chips, opens a quick menu listing every label or relationship type available in the database schema, so you can add or swap labels without typing them. For menus with many items, you can filter them by typing part of its name, then use the arrow keys to jump between matching items:
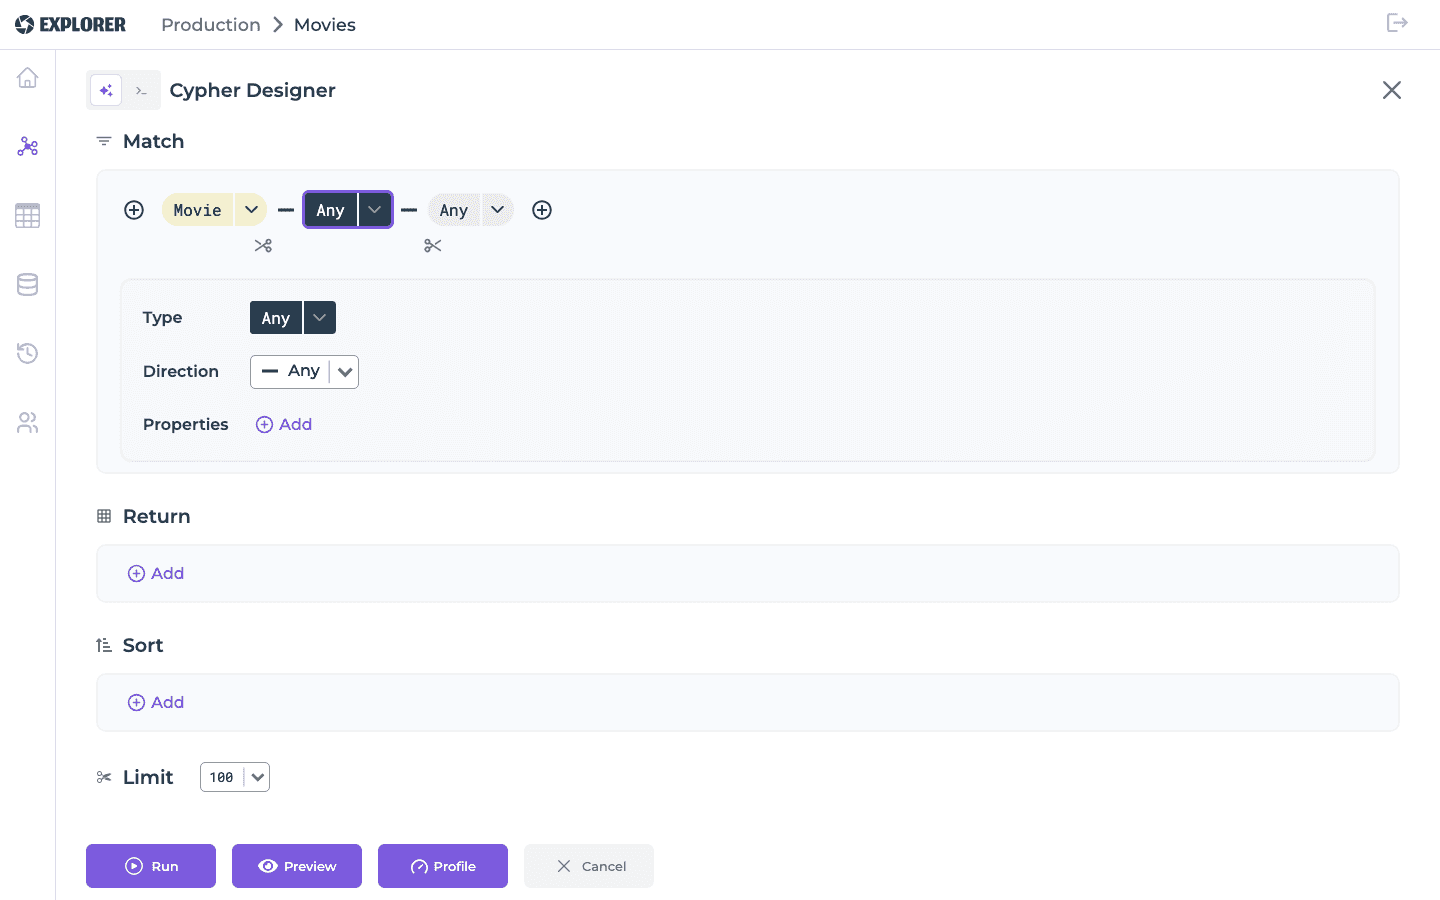
The same applies to relationships — pick a type and a direction, and optionally filter it by property, right from the path:
Filtering by property
Clicking a node or relationship also lets you add a property filter, choosing the property, an operator and a value to filter on. The value field accepts Cypher literals — numbers, booleans, null, strings, and lists (for example 1, TRUE, null, 'x\ny' or ["a", "b"]) — and sends them as-is; if what you enter isn’t a valid Cypher literal, it’s treated as a plain string instead.
You can also filter using a free-form Cypher expression instead of a property/operator/value triple. Use $ to refer to the node or relationship itself — for example, $.cost > $.revenue generates a WHERE clause like n0.cost > n0.revenue.
Return section
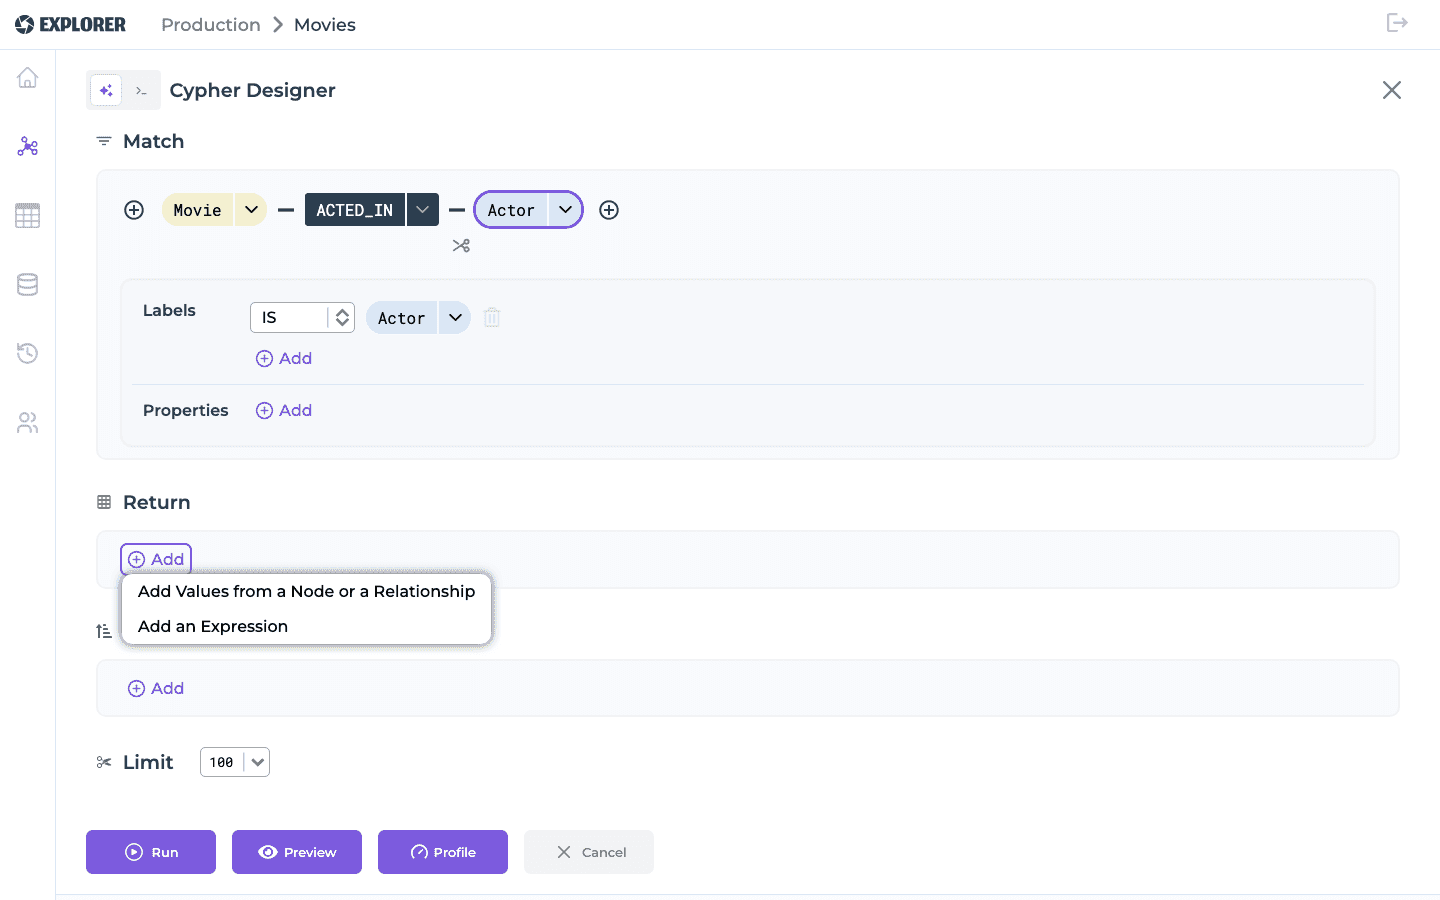
Click Add to choose what a result row displays: either pick a node/relationship from the path and one, several, or all of its properties, or write a free-form Cypher expression:
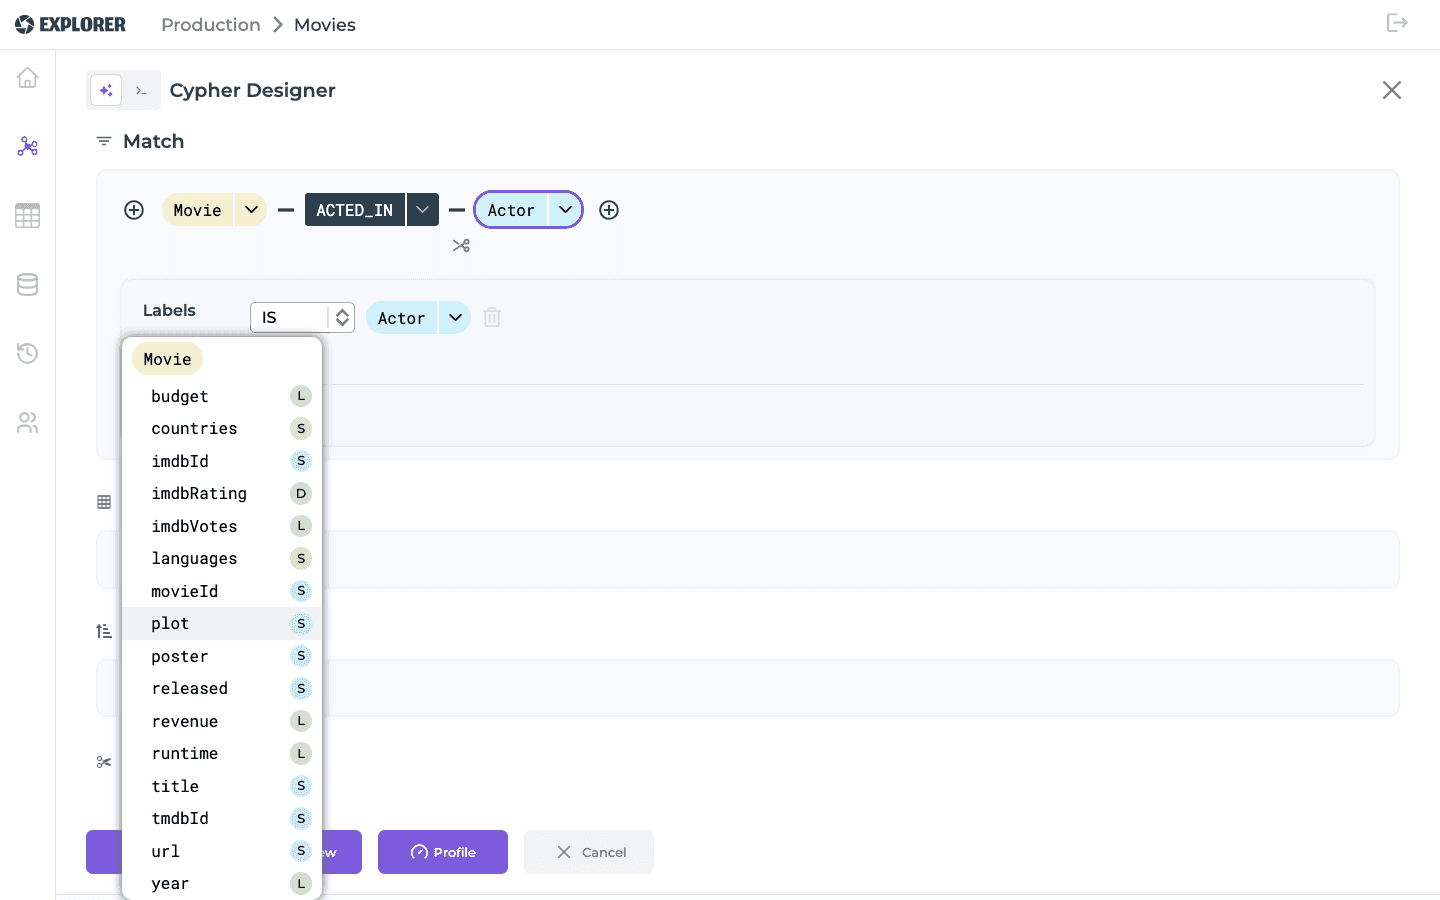
Picking a node or relationship lists every property found on it in the schema, along with its type:
Each returned value can be turned into an aggregate — avg, collect, count, max, min, stDev, stDevP, or sum — from a dropdown next to it and can be given a custom column name via an alias field (equivalent to Cypher’s AS).
Sort section
Works the same way as Return — pick a property or write an expression — with an added ASC/DESC switch per row to control sort direction. Rows are applied in the order they’re listed, matching Cypher’s ORDER BY behavior for multiple keys.
Limit section
A dropdown lets you cap the number of returned rows to 10, 100, or 500 (the default is 100).
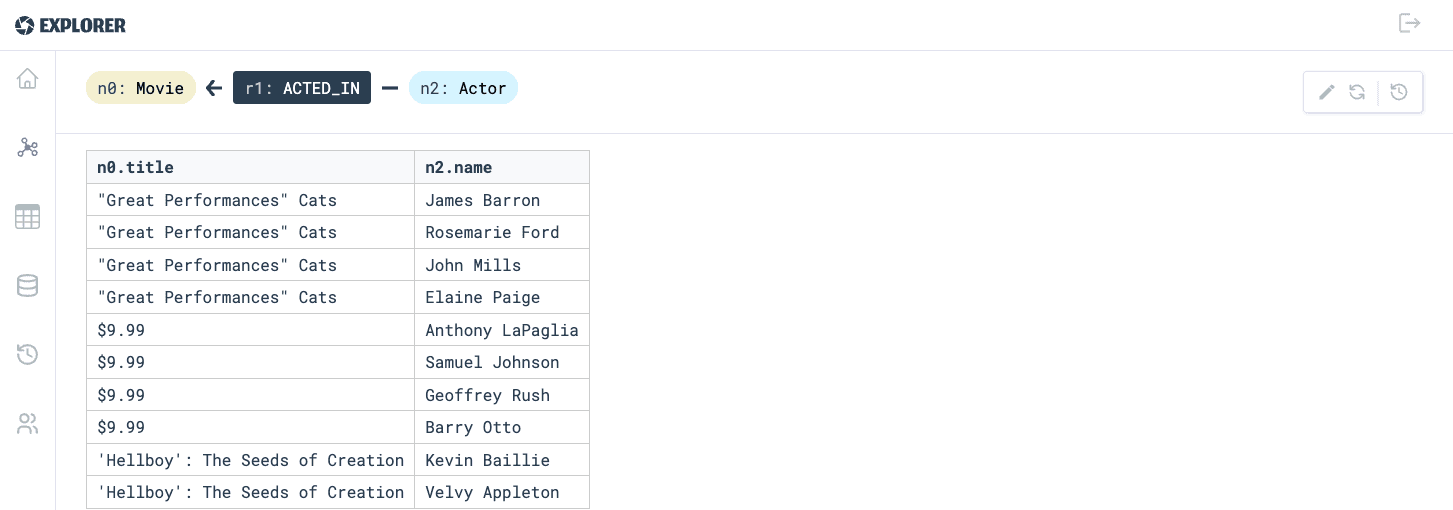
Here’s a completed example — movies and the actors who acted in them, sorted by title, limited to 10 rows:
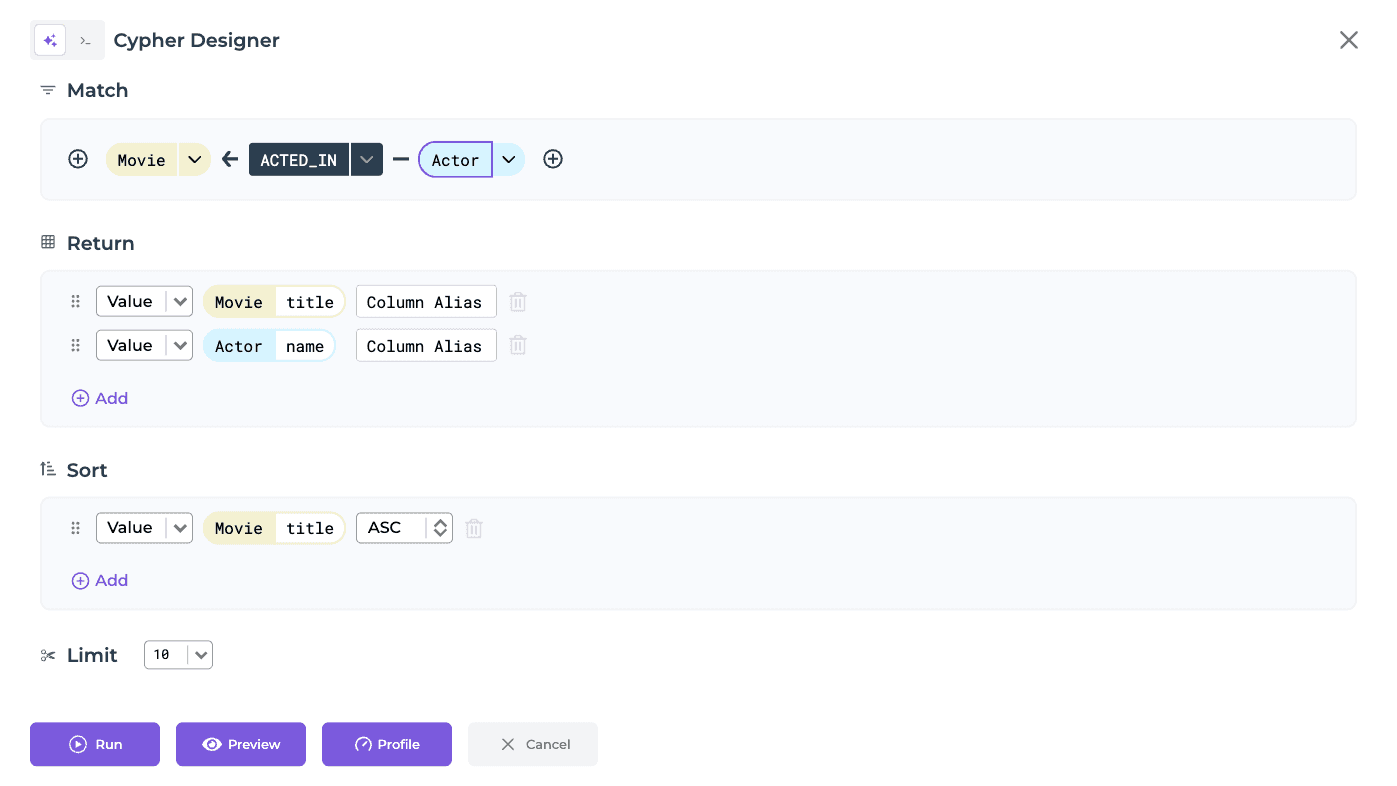
Running it produces a table with one column per returned value, using the aliases (or auto-generated names) as headers:
Cypher Editor
The Cypher Editor is the alternative to the Designer: a free-form text input where you write any Cypher query yourself. Switch to it with the editor icon next to the Designer icon, at the top of the panel:
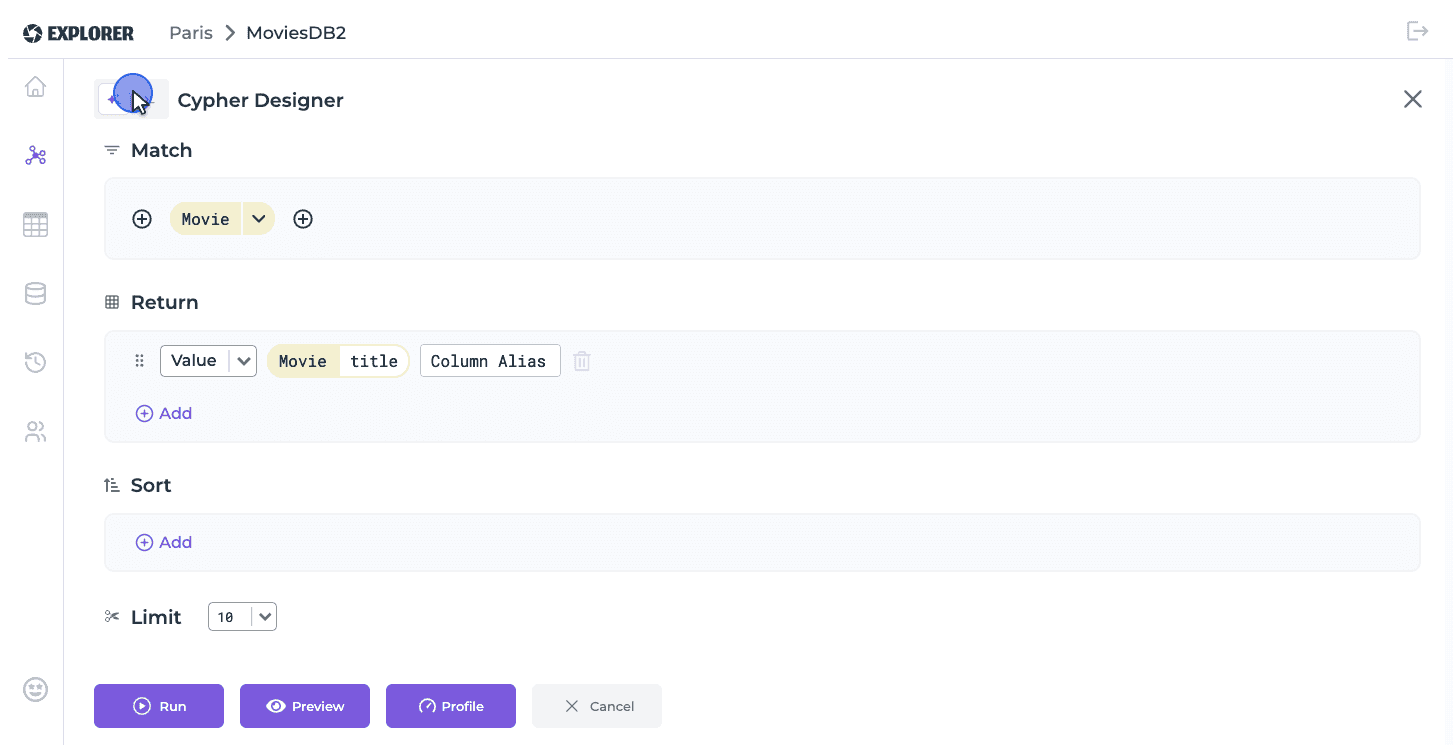
Switching from Designer to Editor preserves the generated Cypher query, allowing you to continue editing it manually.
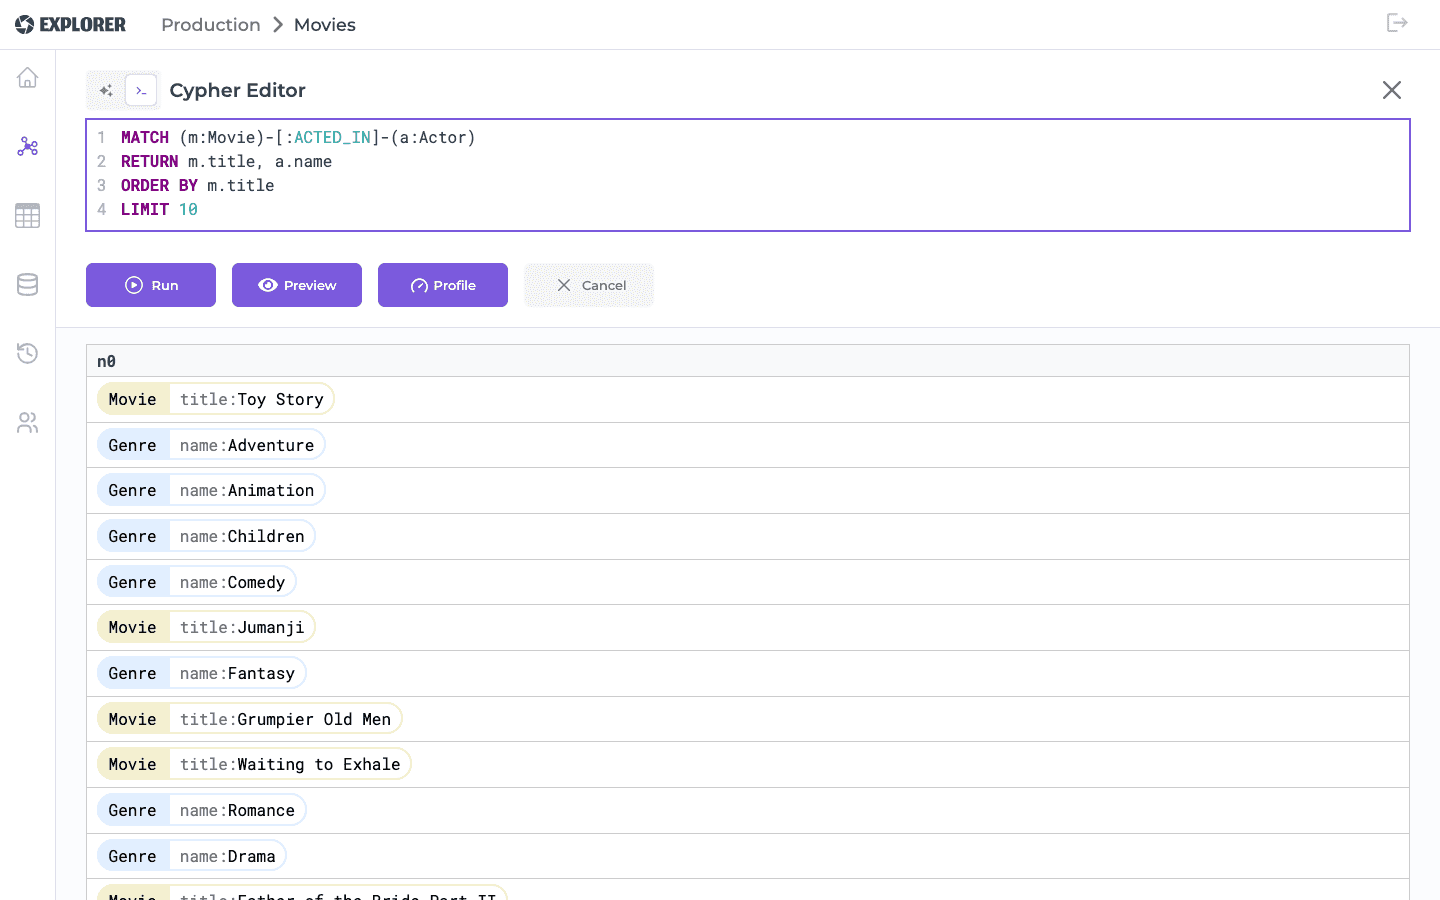
Once a query has run, right-click the generated query bar above the results — not the editor’s text input — to open a context menu with actions such as copying the query text or running it as a profile (see Profiling a query).
Profiling a query
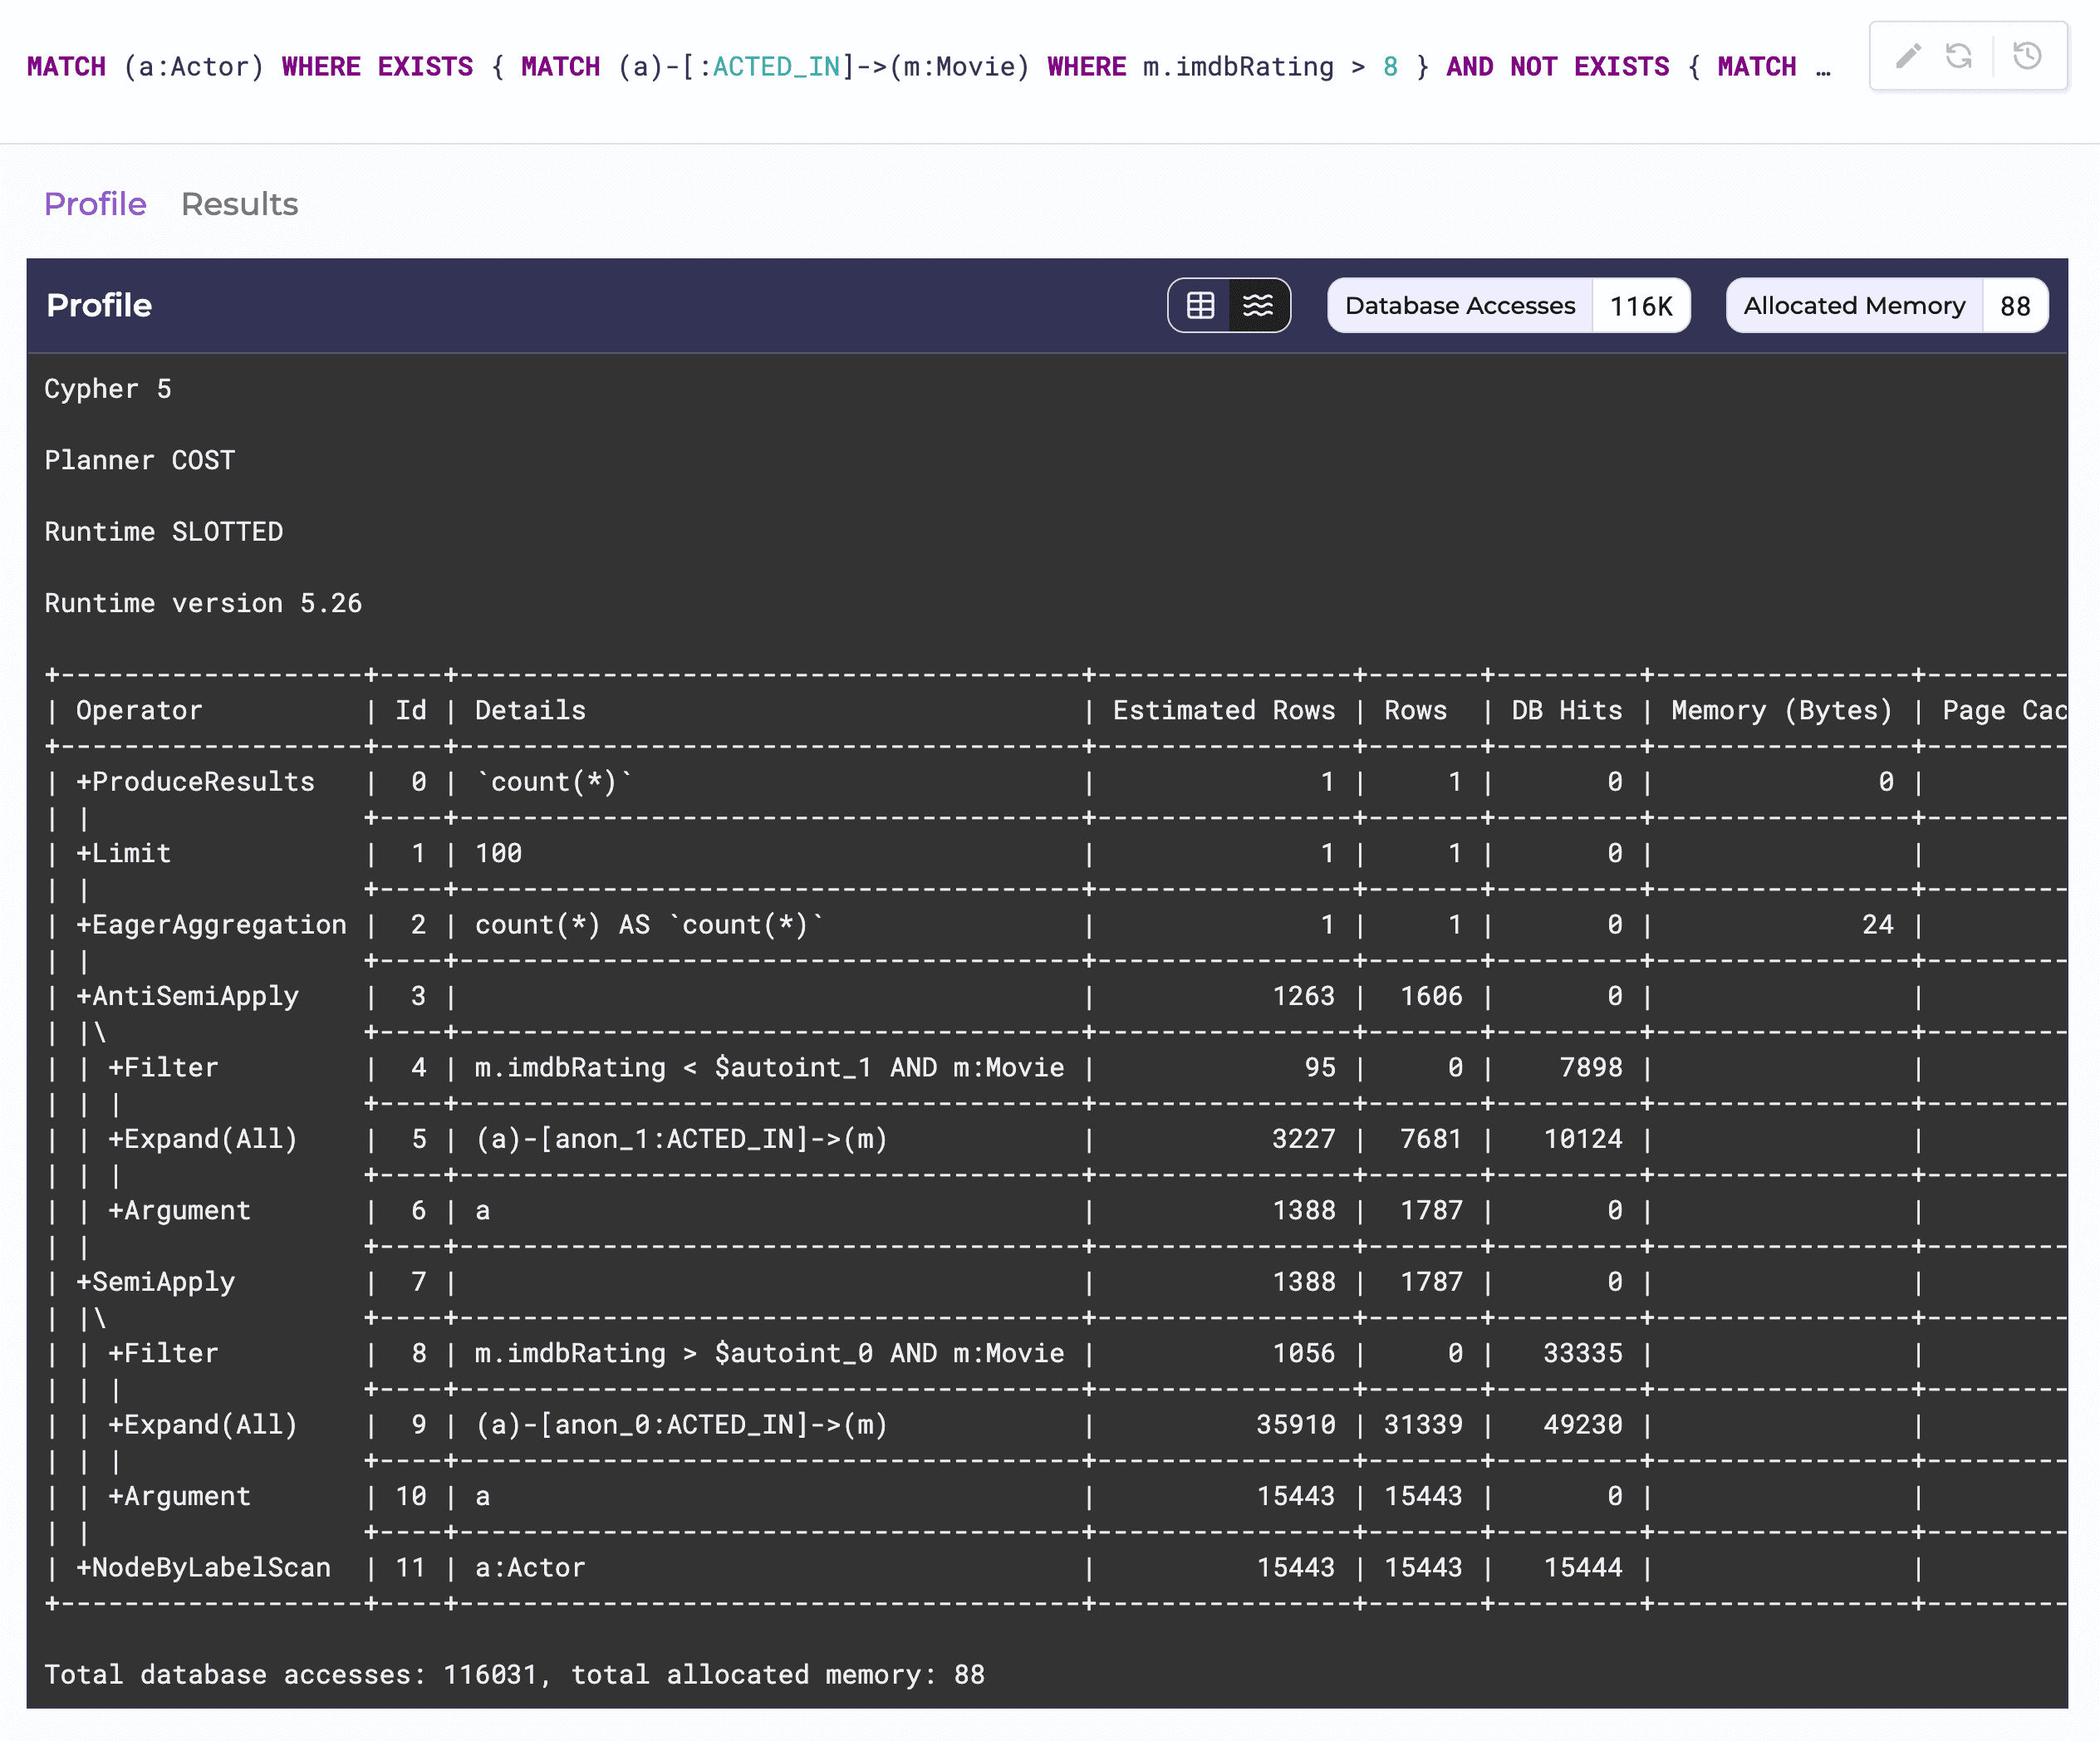
Instead of just running a query, you can profile it to understand how the database executes it. Trigger a profile from the editor’s context menu or its “Profile” action; Explorer runs the query with Cypher’s PROFILE and switches the results panel to a Profile view.
The profile view shows the query plan as a tree of operators, with estimated rows, produced rows, memory used and database hits for each step — hits are heat-colored so the most expensive operators stand out at a glance. Branching operators — for example the SemiApply/AntiSemiApply pair generated by an EXISTS/NOT EXISTS subquery — are drawn with indentation and connector lines, making the shape of the plan easy to follow at a glance:
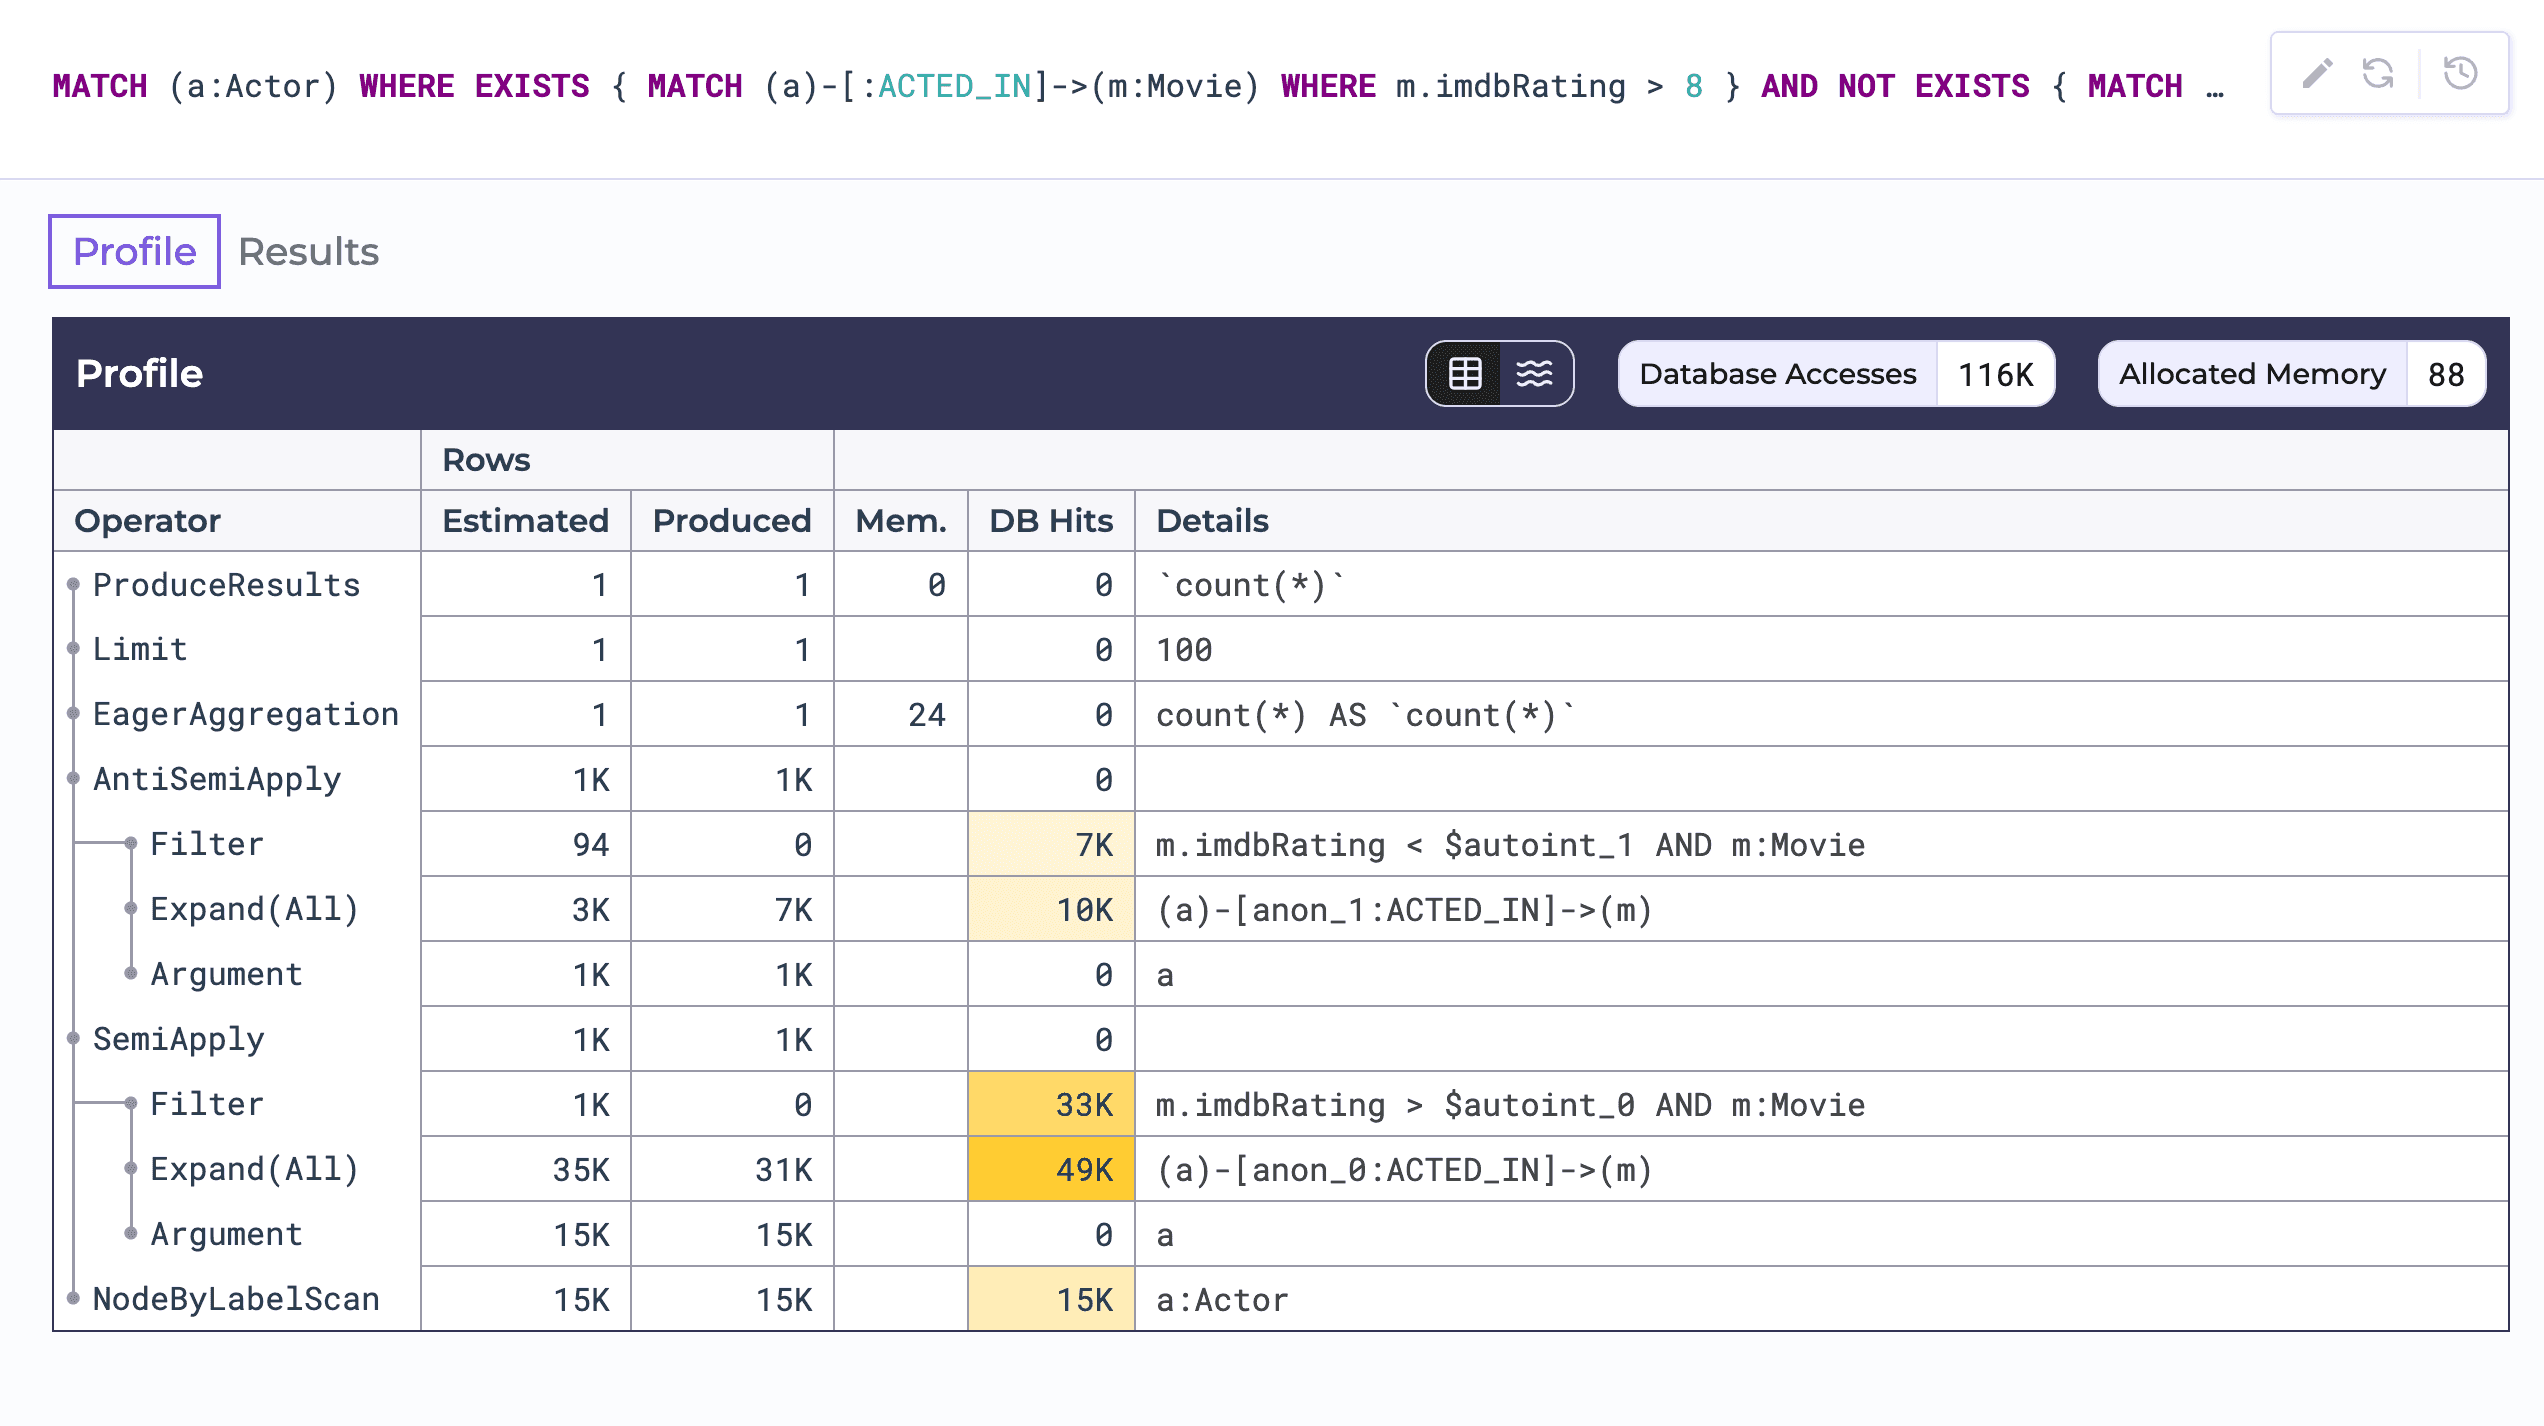
You can toggle to see the plan as raw text if you prefer Neo4j’s native plan output:
Query results
Query results are shown as a table, one row per record and one column per returned value. Node, relationship and path values are rendered as compact, pill-shaped elements rather than raw JSON:
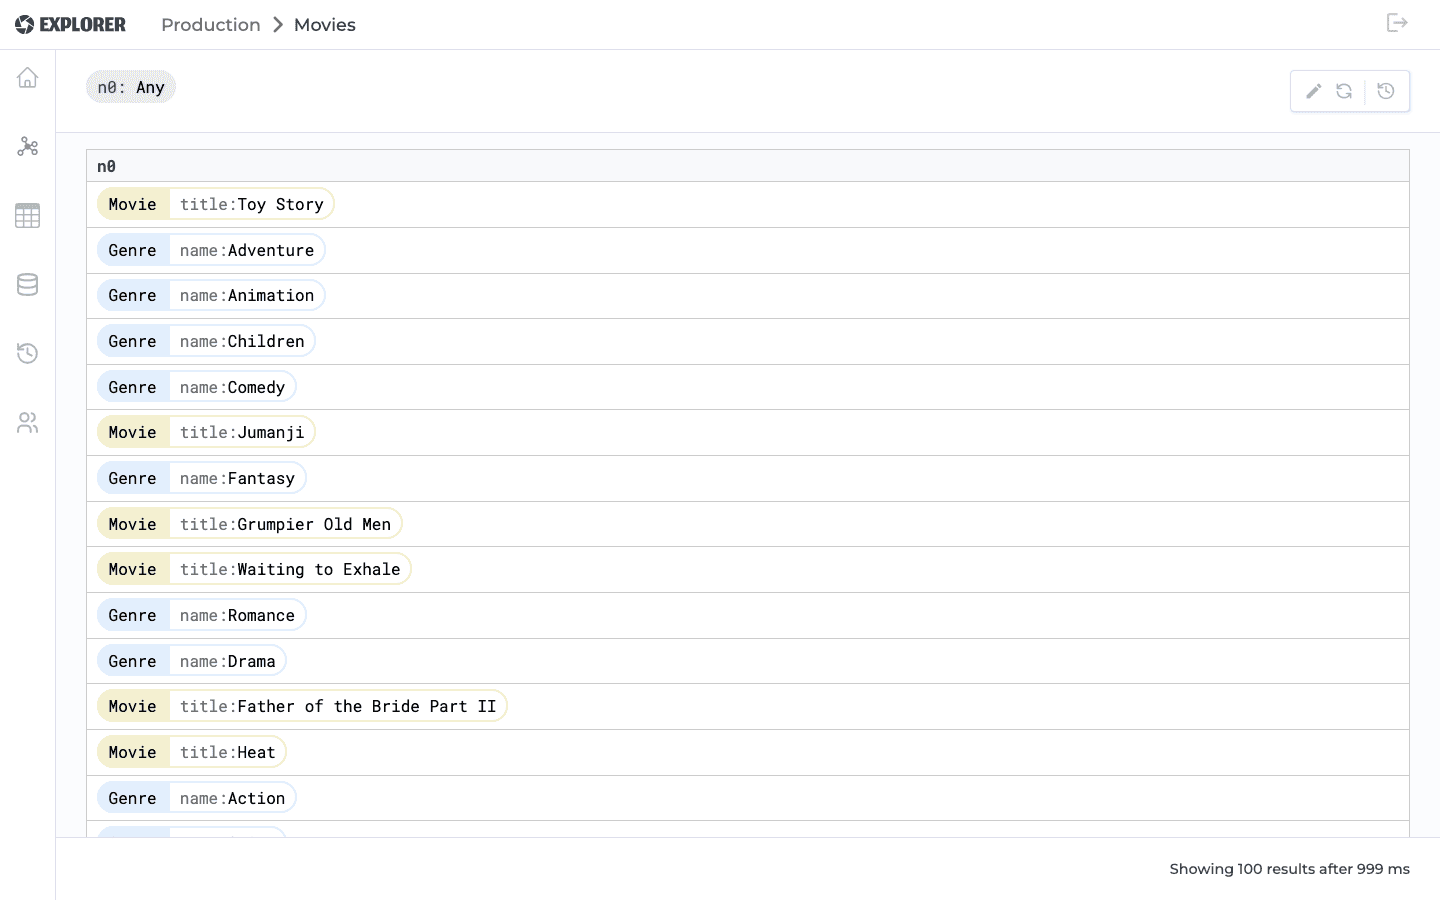
- Hovering a node or relationship pill shows a popover with its full set of properties; hovering a path shows the sequence of nodes and relationships it contains.
- In the table itself, a node is identified by a single “tag” property (its
nameortitleproperty by default) instead of listing every property, to keep rows readable. You can change which property is used as the tag per label from Database Information. - When every record in a column shares the same label(s), Explorer expands that column into one column per property instead of showing pills — a big time-saver over Neo4j Browser’s raw JSON when scanning results.
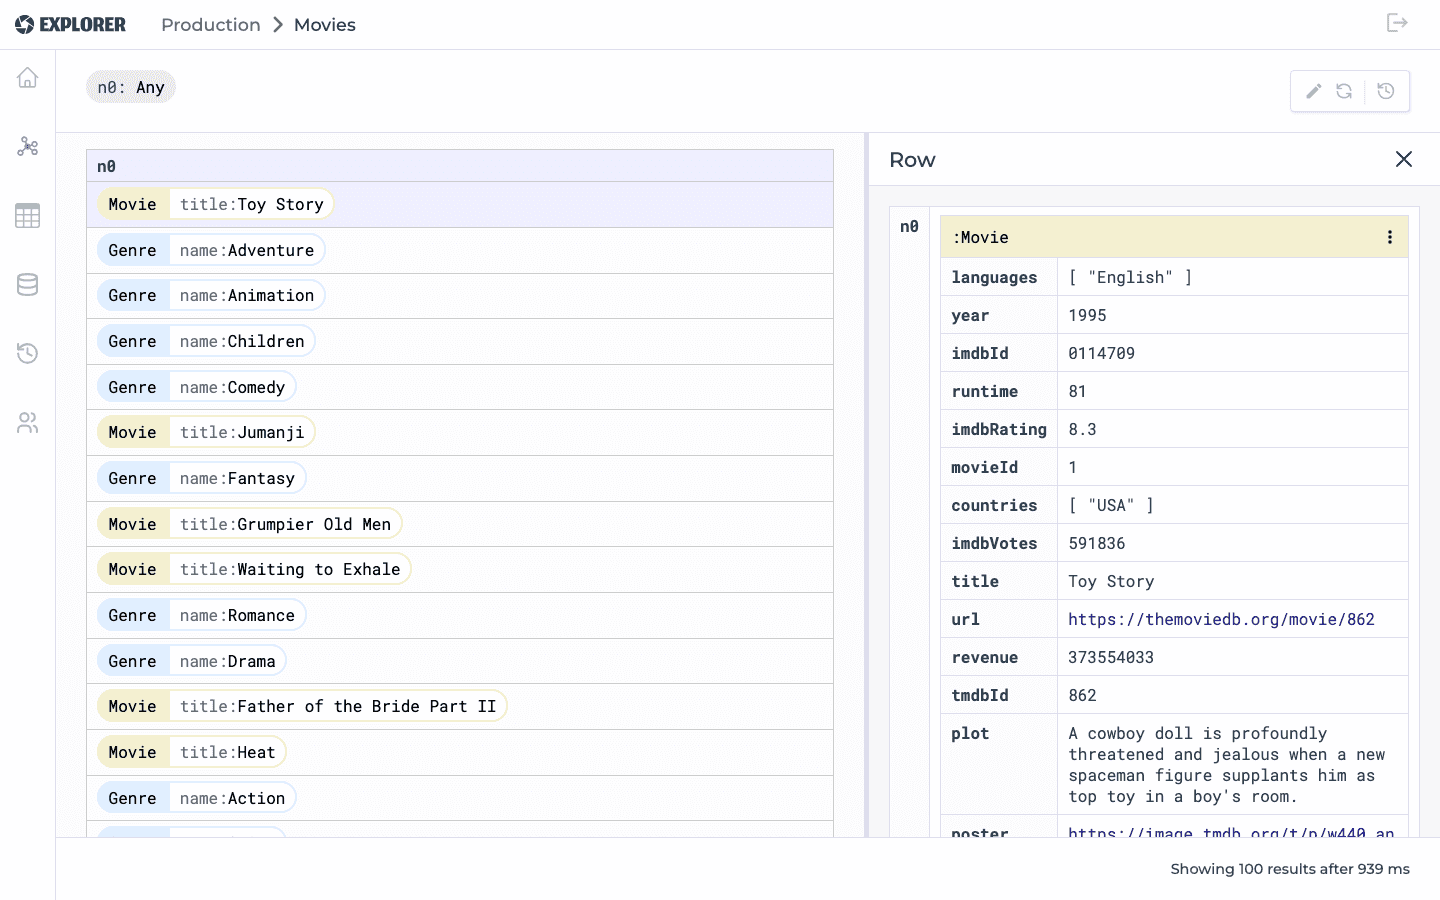
- Clicking a row opens a detail sidebar with the full record:
- Right-clicking a node in the results lets you jump straight to a new query showing its neighbors, or reuse it as a starting point for another query.
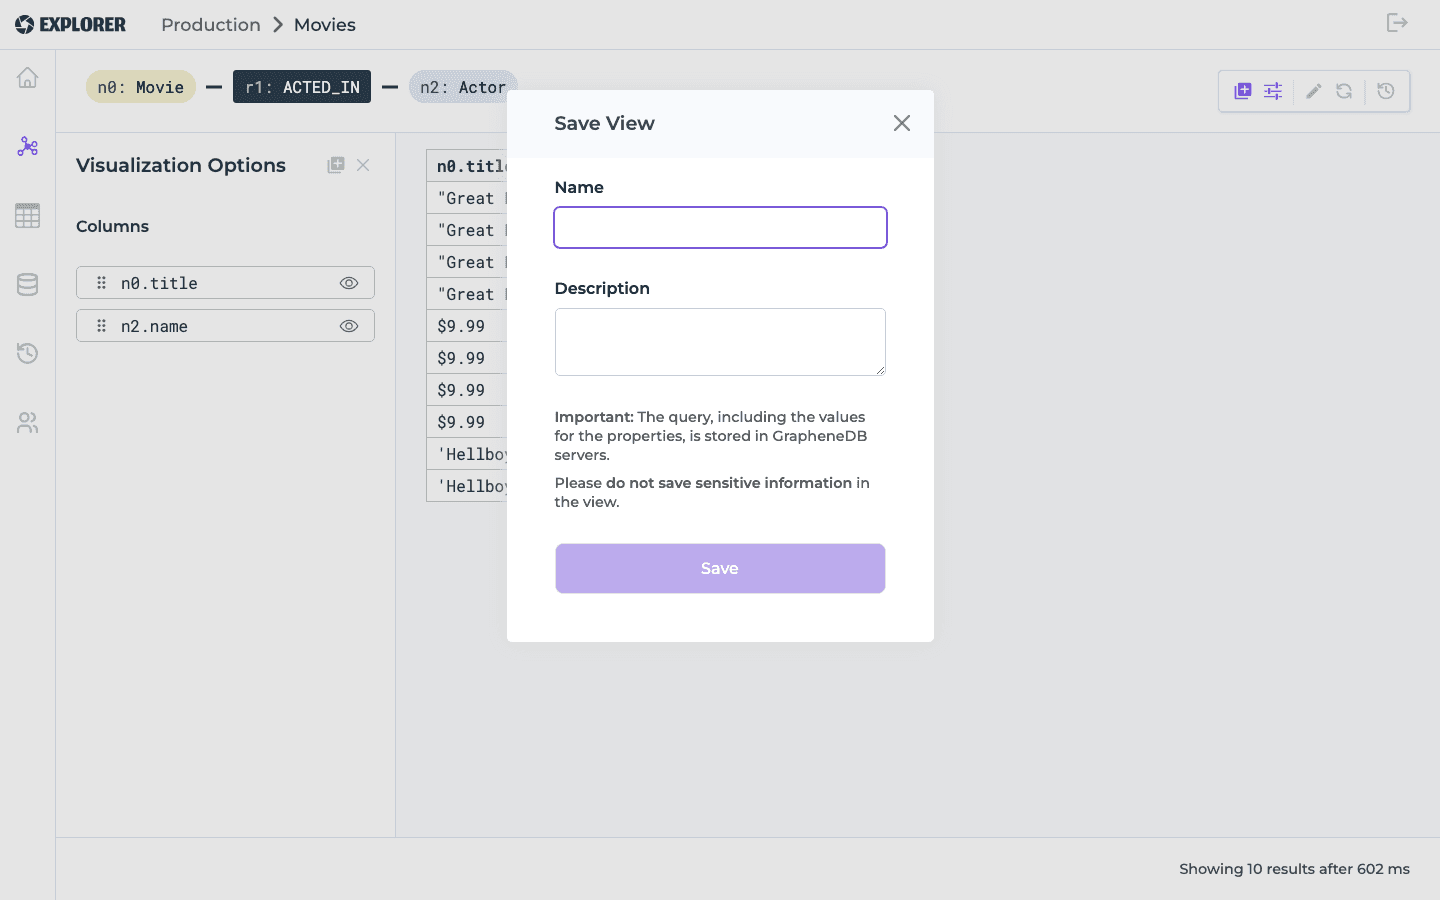
- Use the sliders icon above the table (“Visualization Options”) to show/hide, reorder or group columns, and the ”+” icon next to it to save the current query and layout as a View — this is also where the reminder about not saving sensitive data appears:
If the query returns a server warning (for example, about a missing index or an unbounded pattern), it’s surfaced in a notifications panel after the results load. Query errors are shown with the raw error message returned by the driver.
Query history
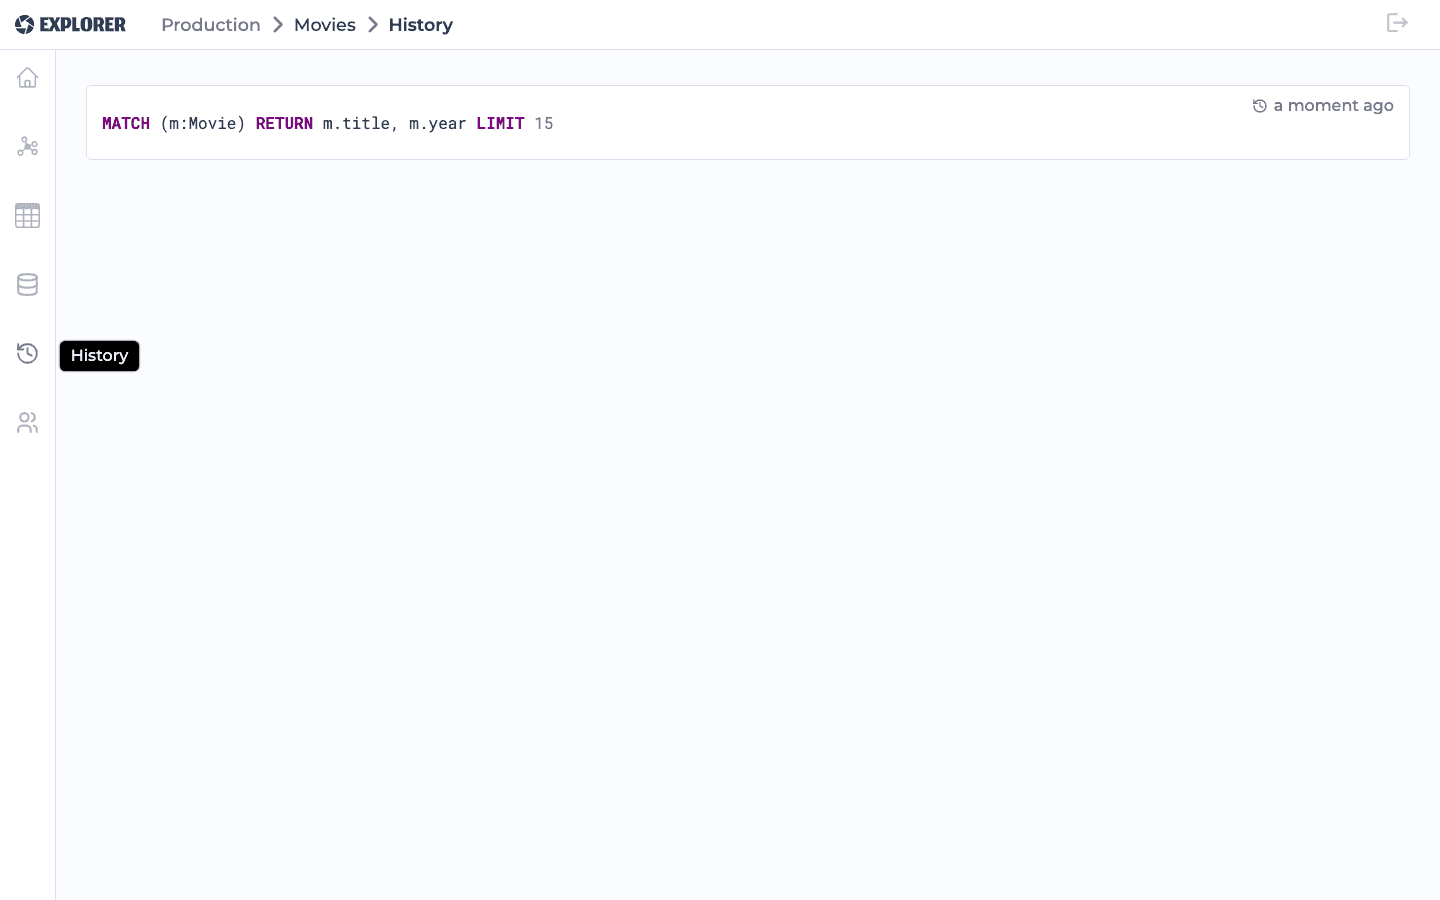
Explorer keeps a history of the queries you’ve previously run against the current database, available from the History page in the sidebar, so you can find and re-run or re-open a past query instead of retyping it.
Database User management
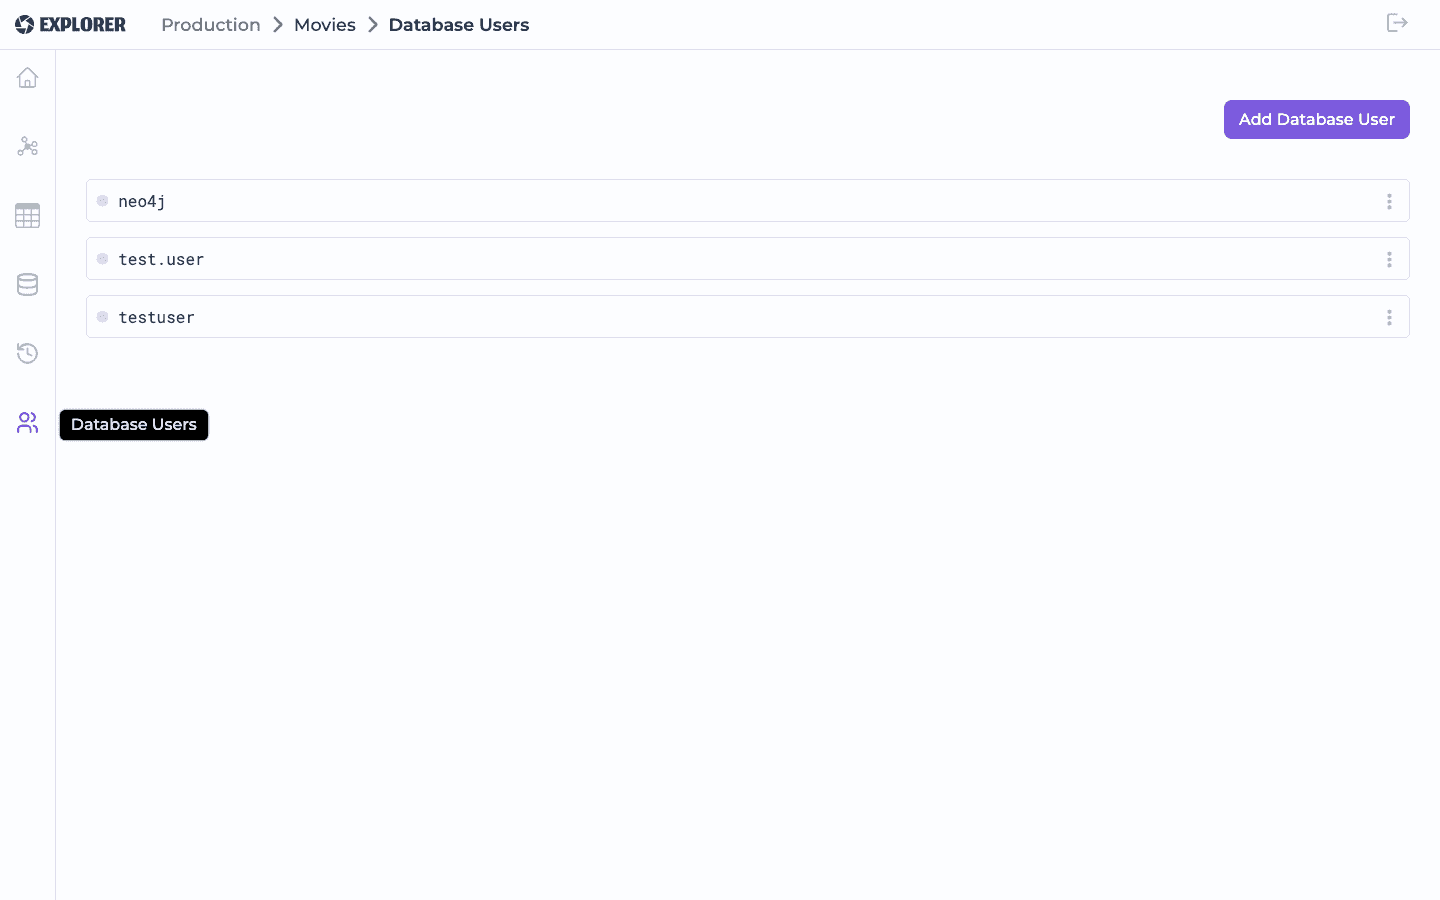
From this view in Explorer you can create, edit and delete database users:
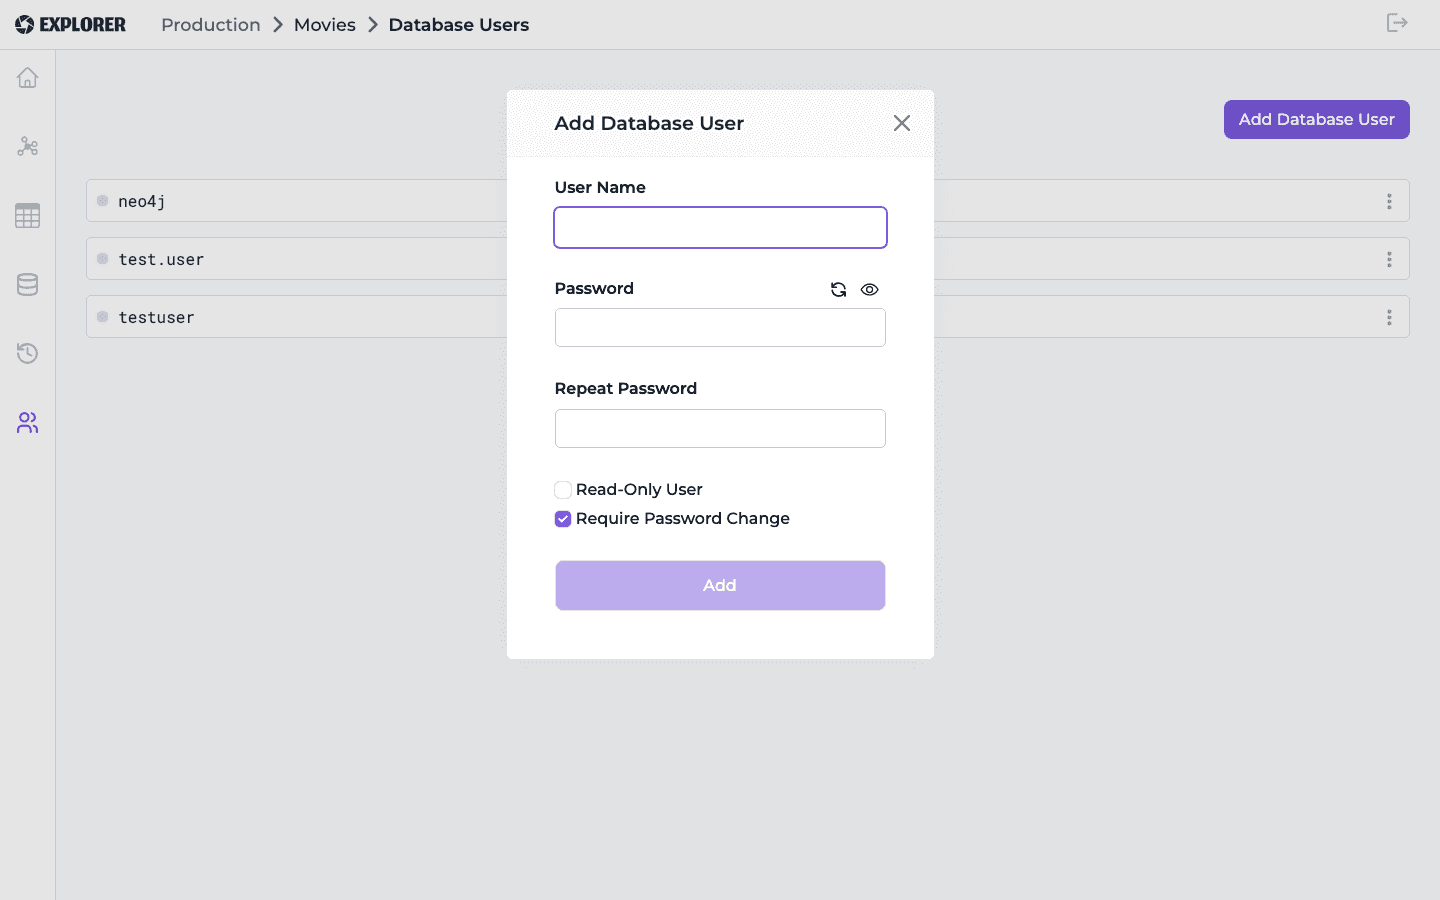
- Add a user with a username and password (there’s a generator and a show/hide toggle for the password field), optionally marking it as a Read-Only User and/or requiring a password change on first login:
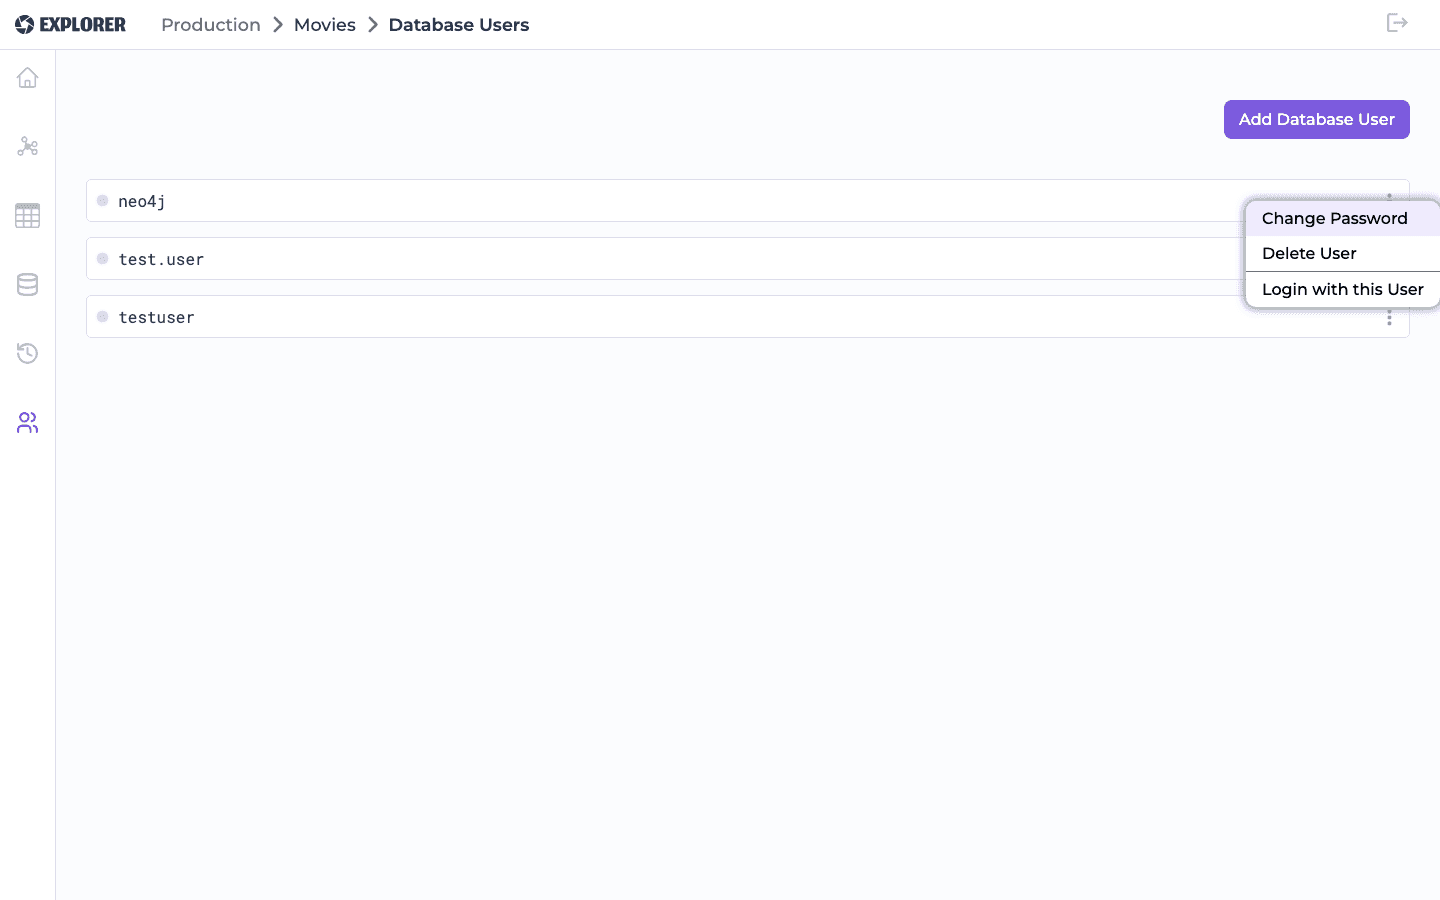
- Change password, delete, or log in as an existing user from its row menu:
Database Information
The Database Information view lets you visualize the schema of the database as an interactive canvas: node labels are shown as boxes, connected by the relationship types found between them, with zoom-to-fit and 1:1 zoom controls, plus a search box that filters and highlights matching labels.
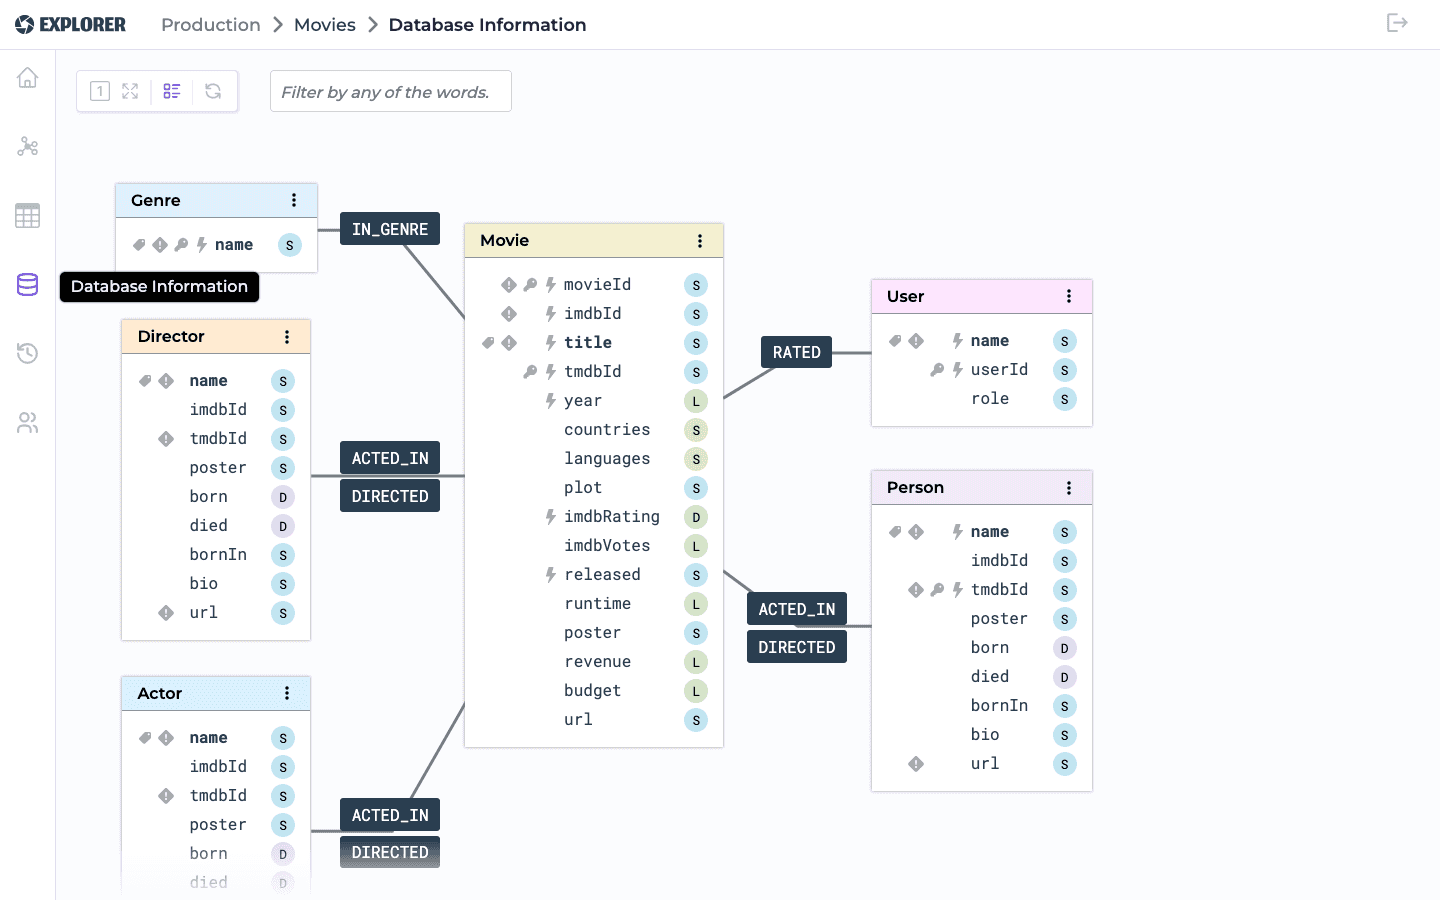
You can toggle whether each label’s properties are shown, including whether a property is indexed, unique or mandatory (shown as small icons next to the property name). From here you can also customize, per label:
- Node tag — which property identifies a node of that label elsewhere in the UI (for example, in the results table).
- Label color — the color used to draw nodes of that label throughout Explorer.
Both settings are saved per database, so they apply for every user connecting to it (except on the test database, where they can’t be persisted).
Views
A View is a saved query together with its visualization options (column visibility, order and grouping). Views are available only when connected to a GrapheneDB-managed instance — not when connected via “Use URI”.
Create a new View
Build a query with the Designer or Editor, then use “Create New View” in the toolbar to give it a name and description and save it. Only the query and its visualization settings are saved — not the data returned by running it. Because Views are stored on GrapheneDB’s servers, avoid saving queries that embed sensitive data (for example, literal property values you don’t want persisted).
Edit a View
Open a saved View from the Saved Views list, change the query or its visualization options, and use “Edit View” to update it in place.
Delete Views
From the Saved Views list, or from the toolbar while a View is open, choose the delete action to remove it:
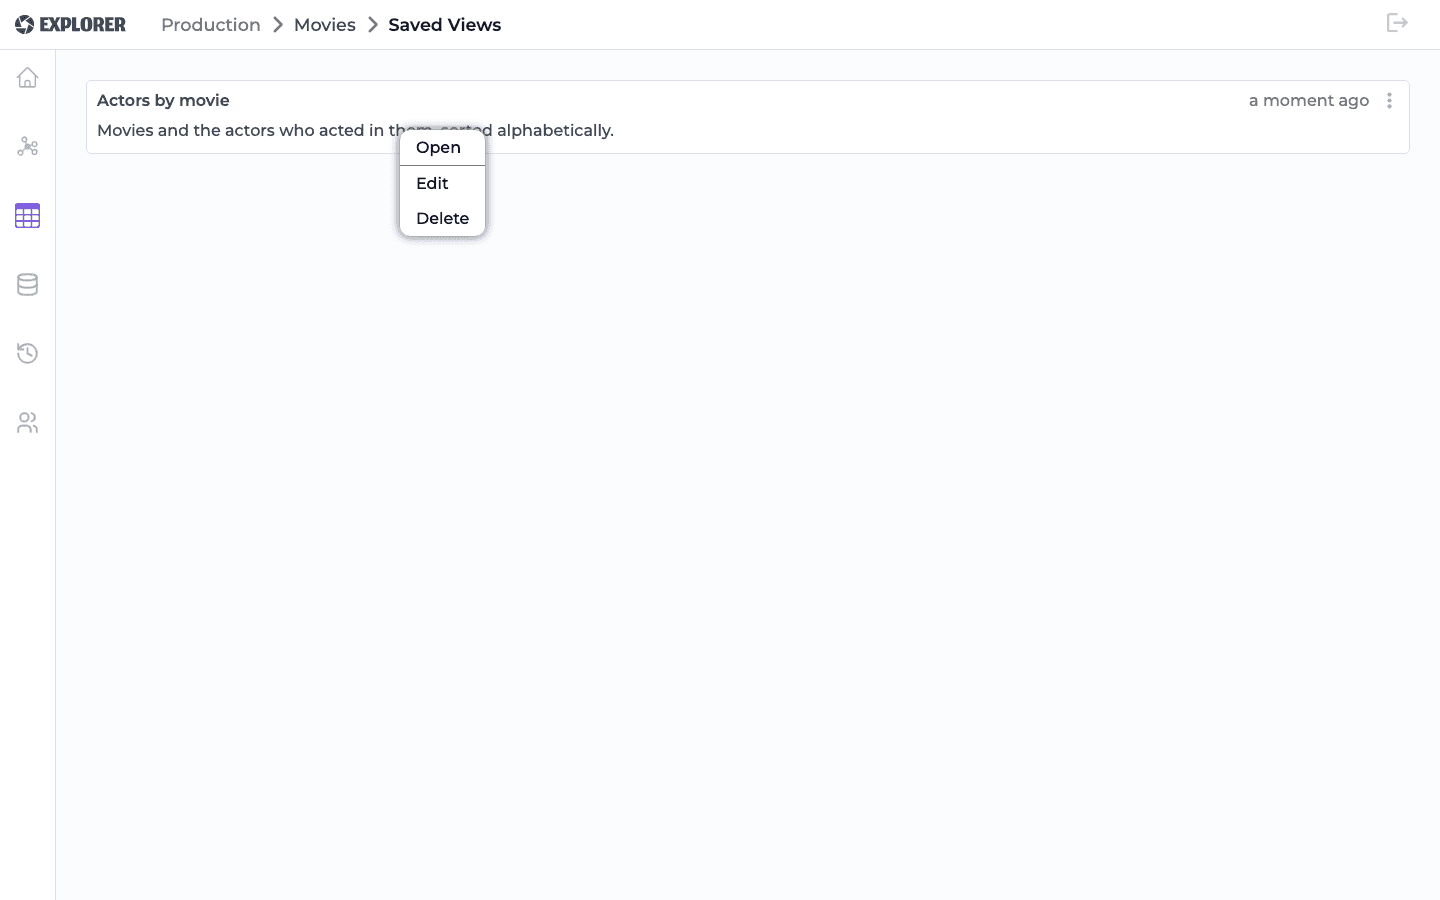
Note: Views are shared at the database level.
Support, Docs & Feedback
The bottom of the sidebar has three links, each opening in a new tab:
- Docs opens this article in our documentation center.
- Support opens Console to create a new support case for your Organization, just like any other support case in Console.
- Feedback opens a short feedback form. We take every submission seriously and use it to help decide what to build next, so let us know what’s working, what isn’t, or what you’d like to see.
Keyboard shortcuts
| Shortcut | Action |
|---|---|
Ctrl+E |
Open the Cypher editor |
Ctrl+Enter |
Run the current query |
Shift+Enter |
Preview the current query |