


We’re proud to present our redesigned Metrics view, featuring many exciting updates that will provide enhanced visibility into your database and server load.
New Database Metrics
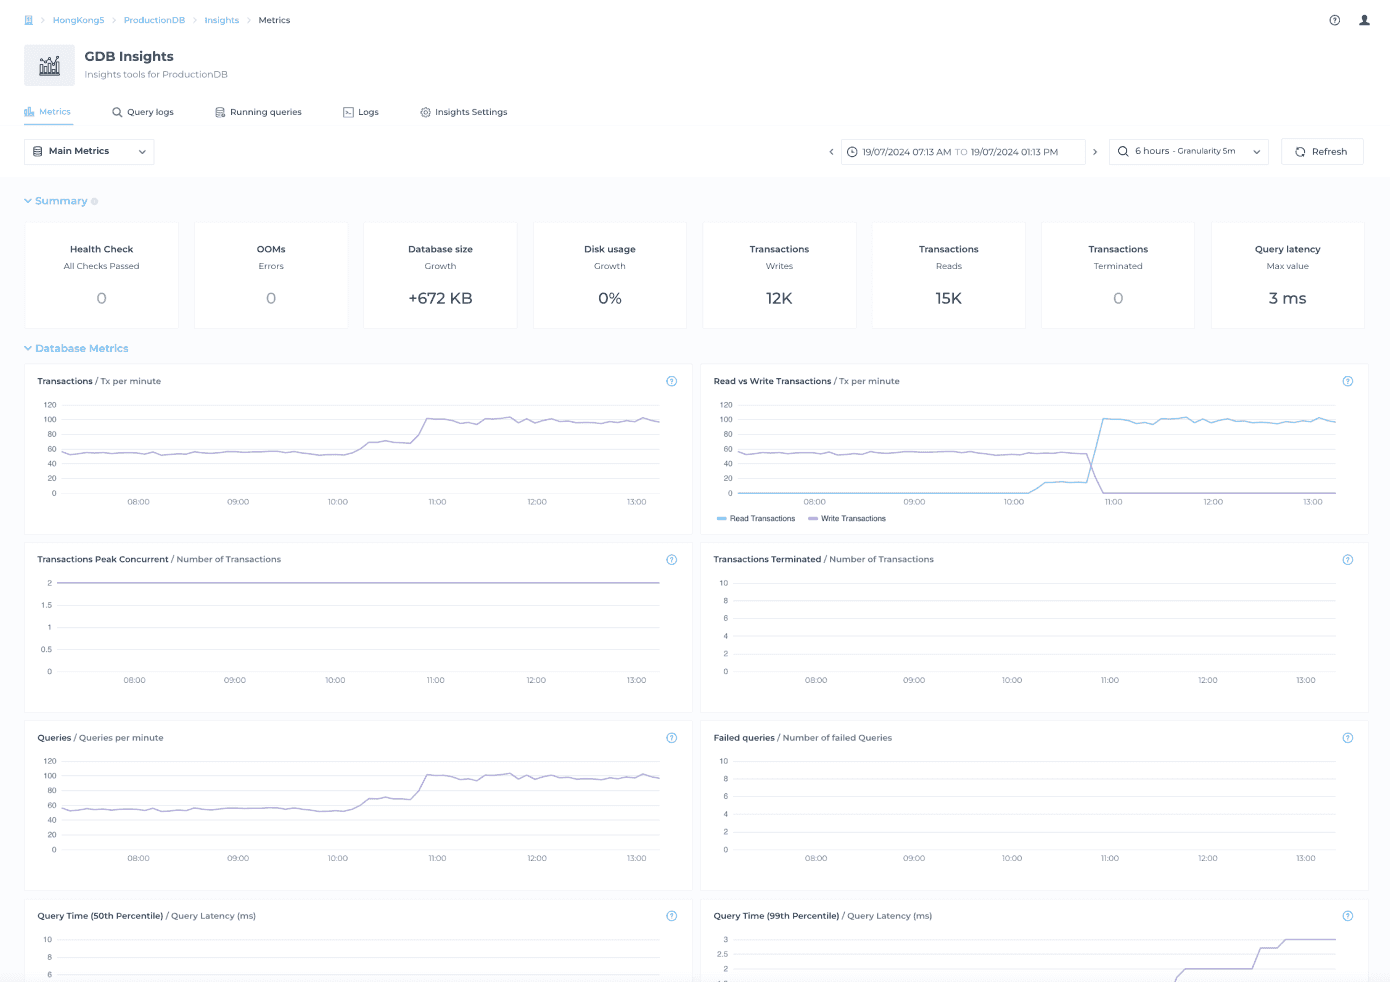
In line with our vision to enhance Neo4j Community with features to make it production-ready, we have introduced new database metrics that will help you better understand your database load. These metrics include for example write/read transaction counts and query latencies, allowing you to gather various statistics on query execution times.
Additional metrics, such as Bolt connections, provide insights into open connections and server concurrency. Furthermore, metrics indicating terminated transactions or failed queries will aid in debugging potential issues or load problems.
Time Windows and Resolution
We’ve listened to your feedback, and you can now navigate back and forth within a selected time window without losing resolution. A larger time window with smaller resolution offers a broad overview, while a smaller time window with higher resolution provides more detailed insights.
New Summary Section
We’ve added a new summary section to Metrics, which aggregates key metrics for the selected time window, such as health checks, OOMs (Out of Memory errors), transactions, and query latencies. This aggregated summary enables you to quickly identify problems or anomalies without checking each metric individually.
How to Get It and More Info
Every new database will include this redesign. Existing databases can get the update via a maintenance operation. More information on this update can be found here.