We enhance Neo4j Community
We’ve developed a set of tools that will allow you to run Neo4j Community in production, like backups, read-replicas, database metrics, query logs and more.
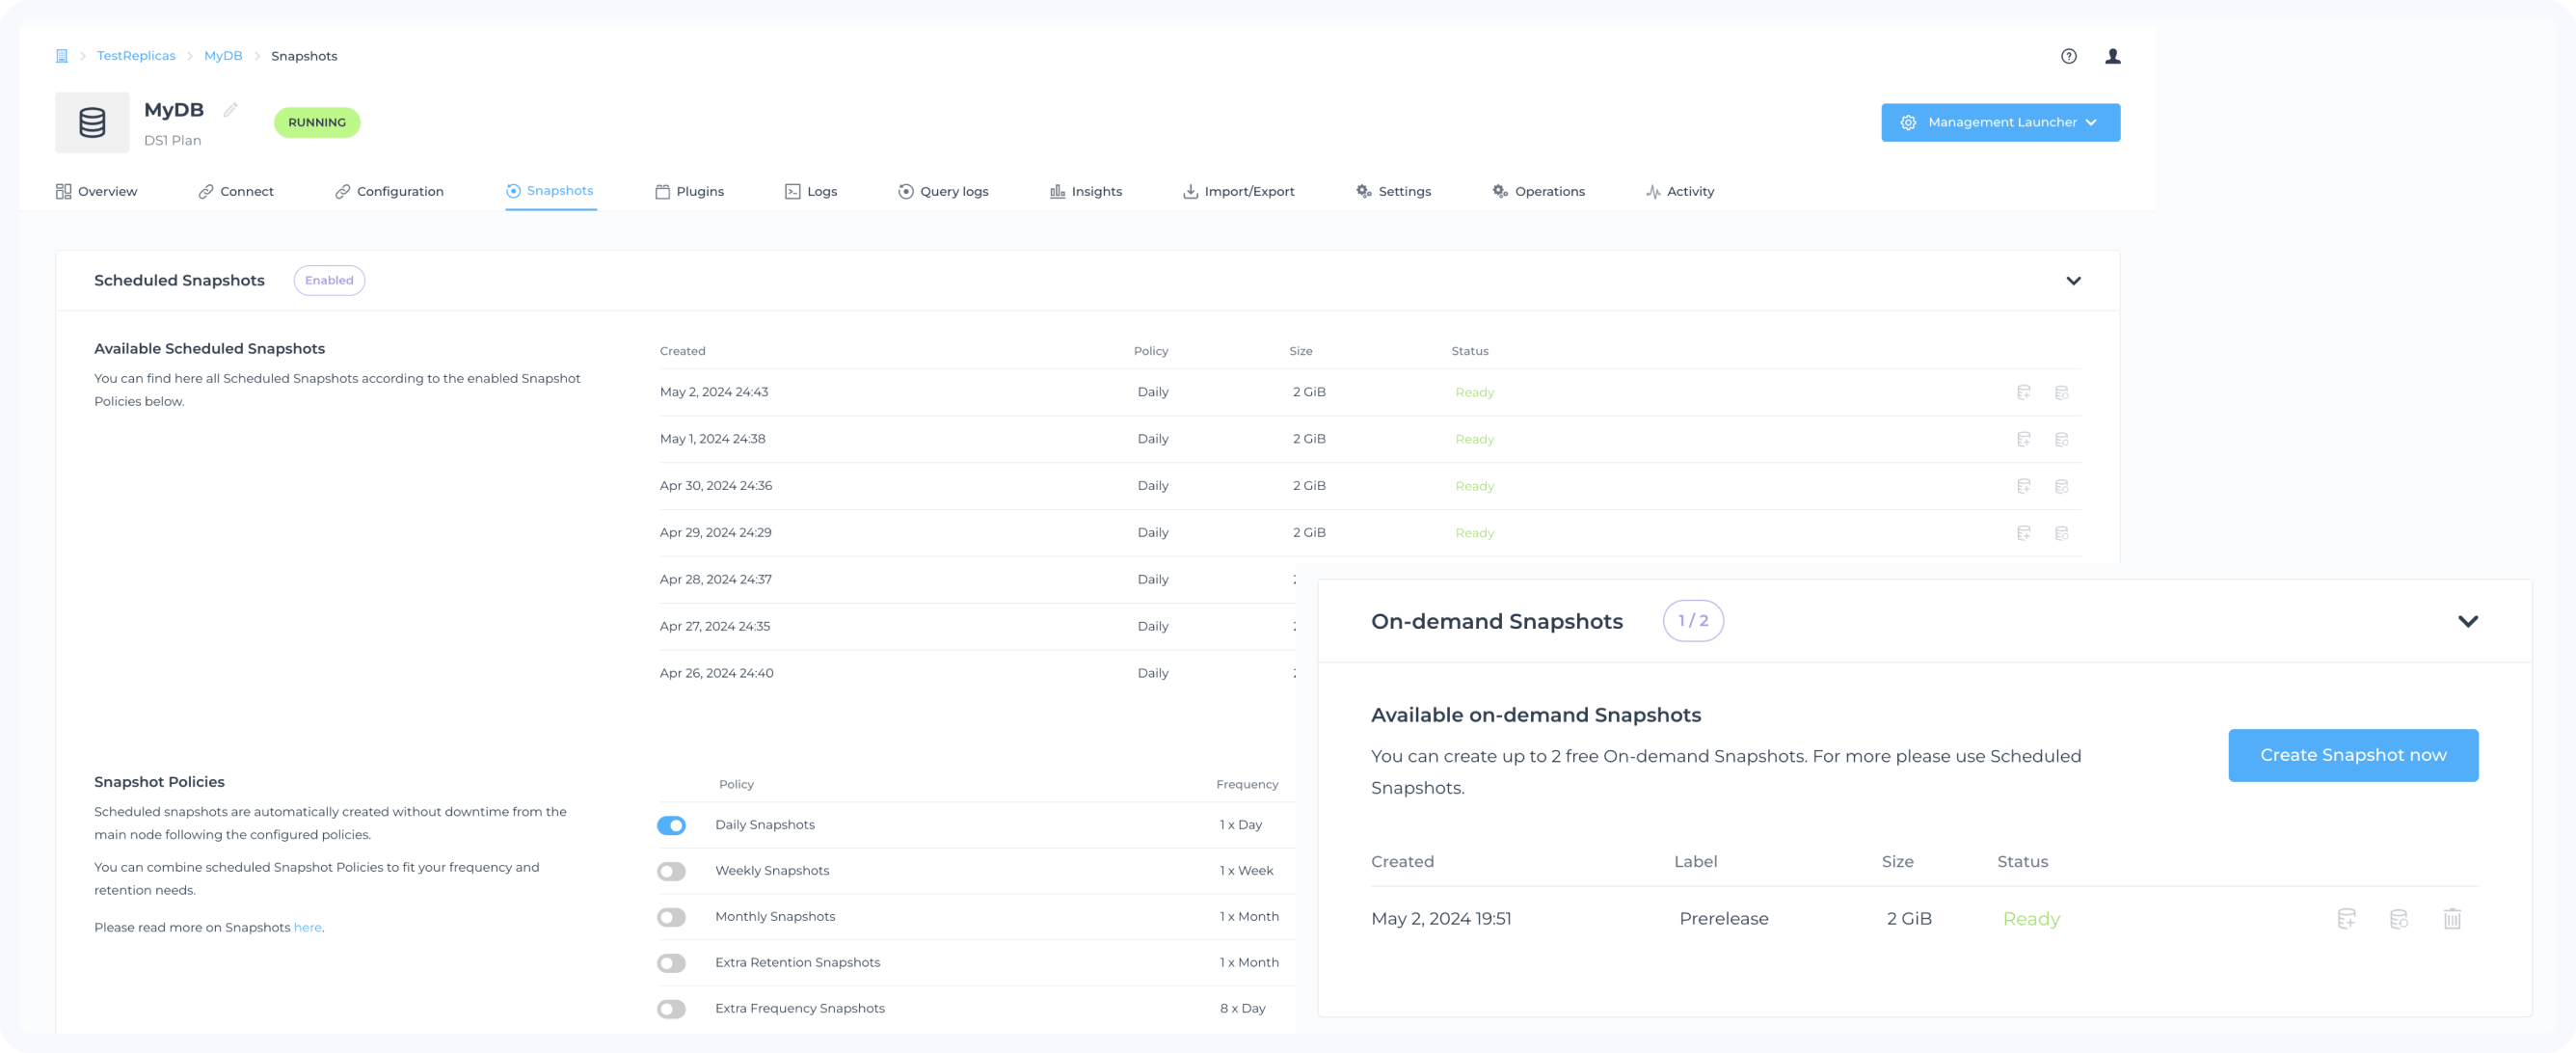
Snapshots
GrapheneDB offers historic metrics of the database and the underlying server, such as healthchecks, OOM errors, CPU, memory, network and disk. Metrics are displayed in the Console as charts that you can consult anytime.
You can select the time window for the historic metrics from the last hour to the last month.
Replicas
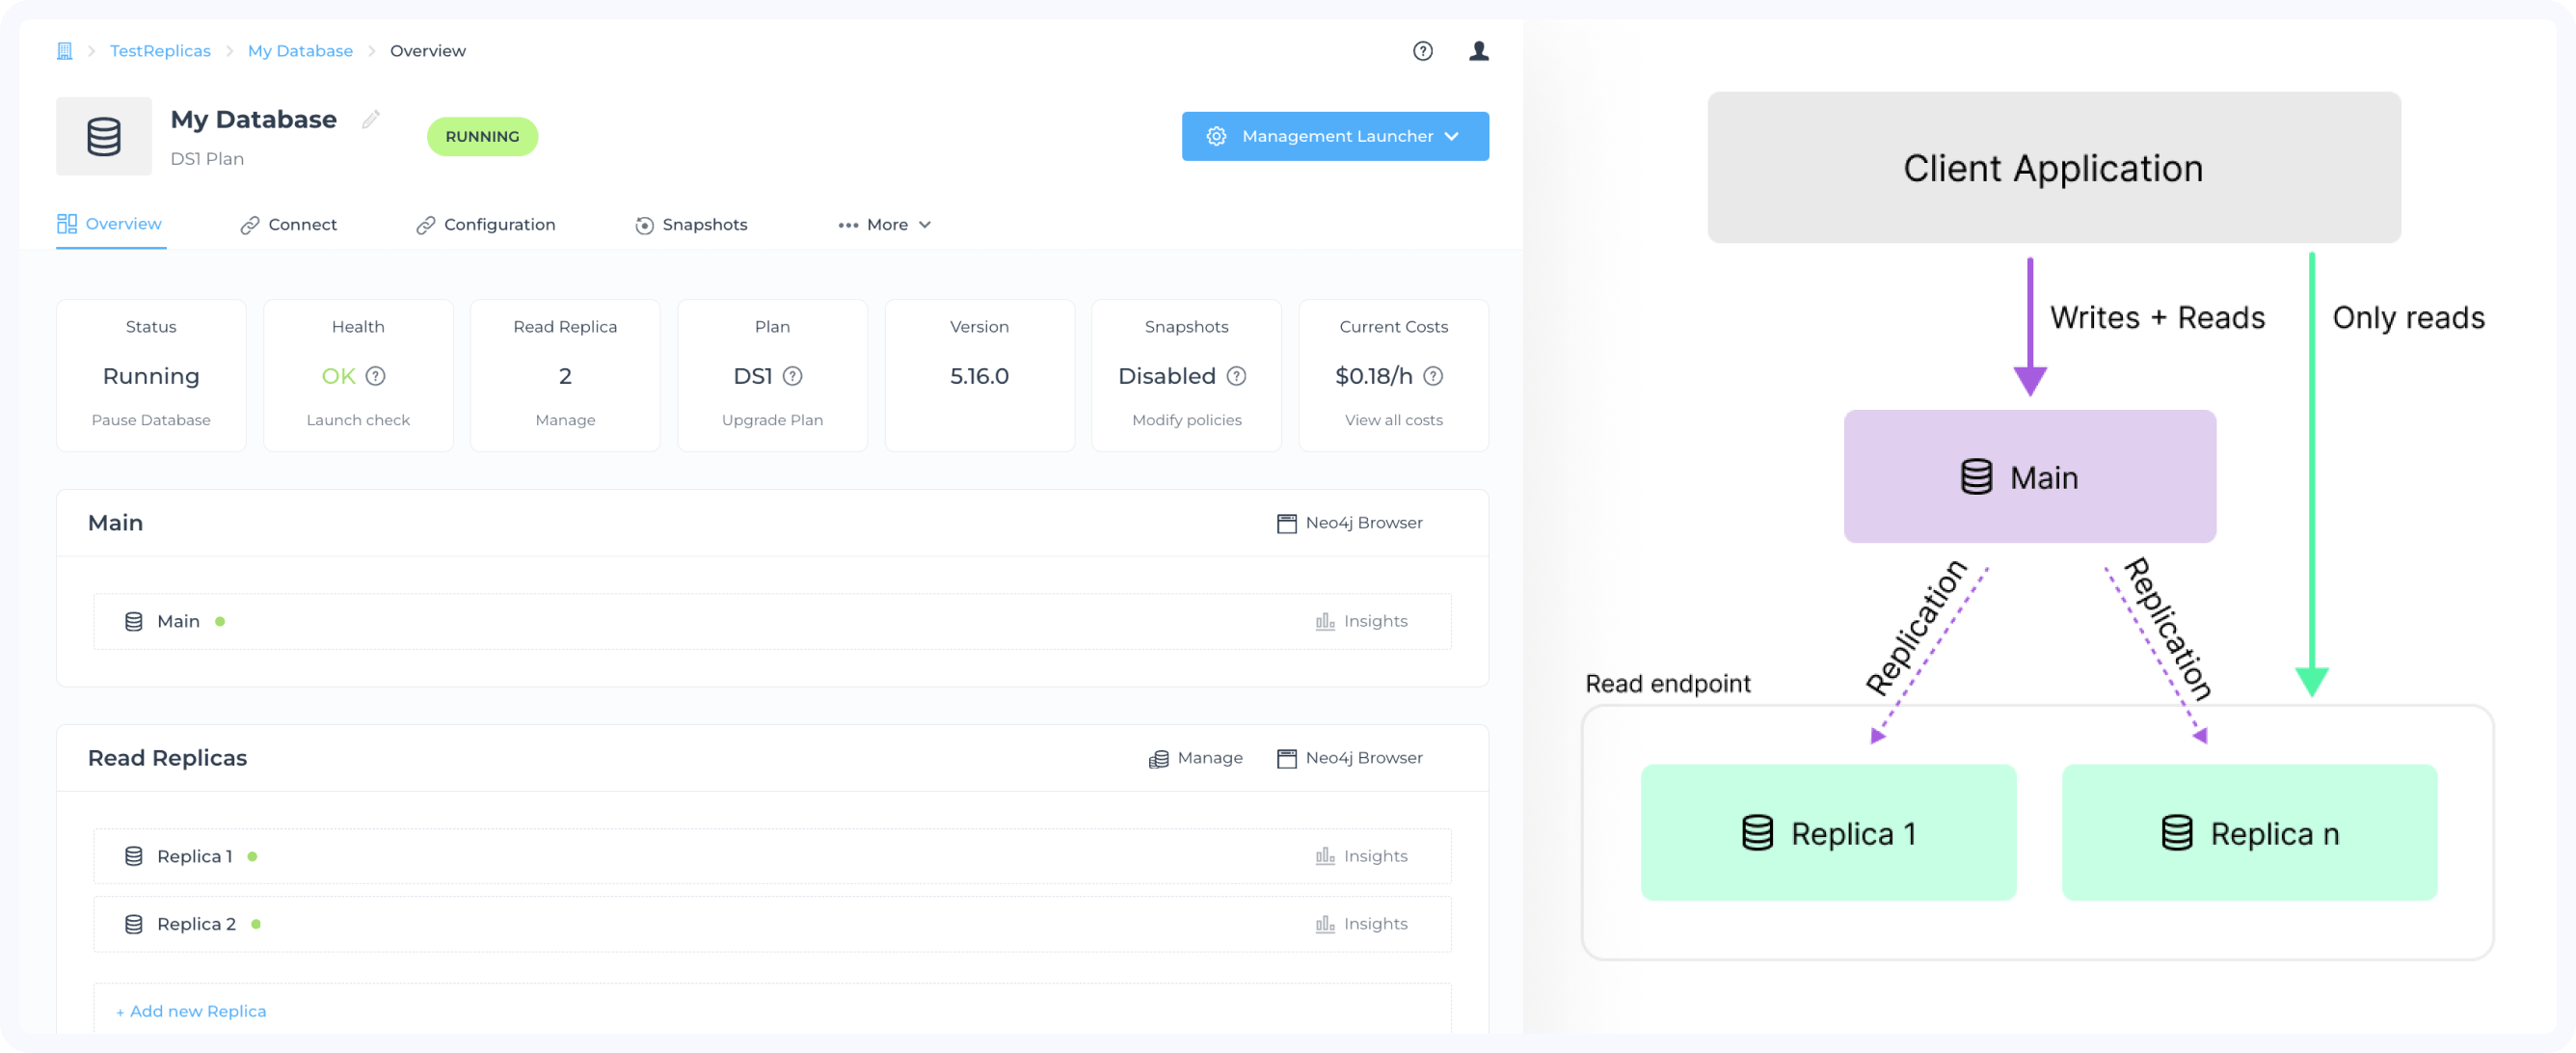
Read-replicas provides redundancy and increases data availability. Replicas are deployed automatically in different Availability Zones, providing a level of fault tolerance against zonal outages.
Additionally if you add more than one Replica, replication can provide increased read capacity as clients can send read operations to different servers.
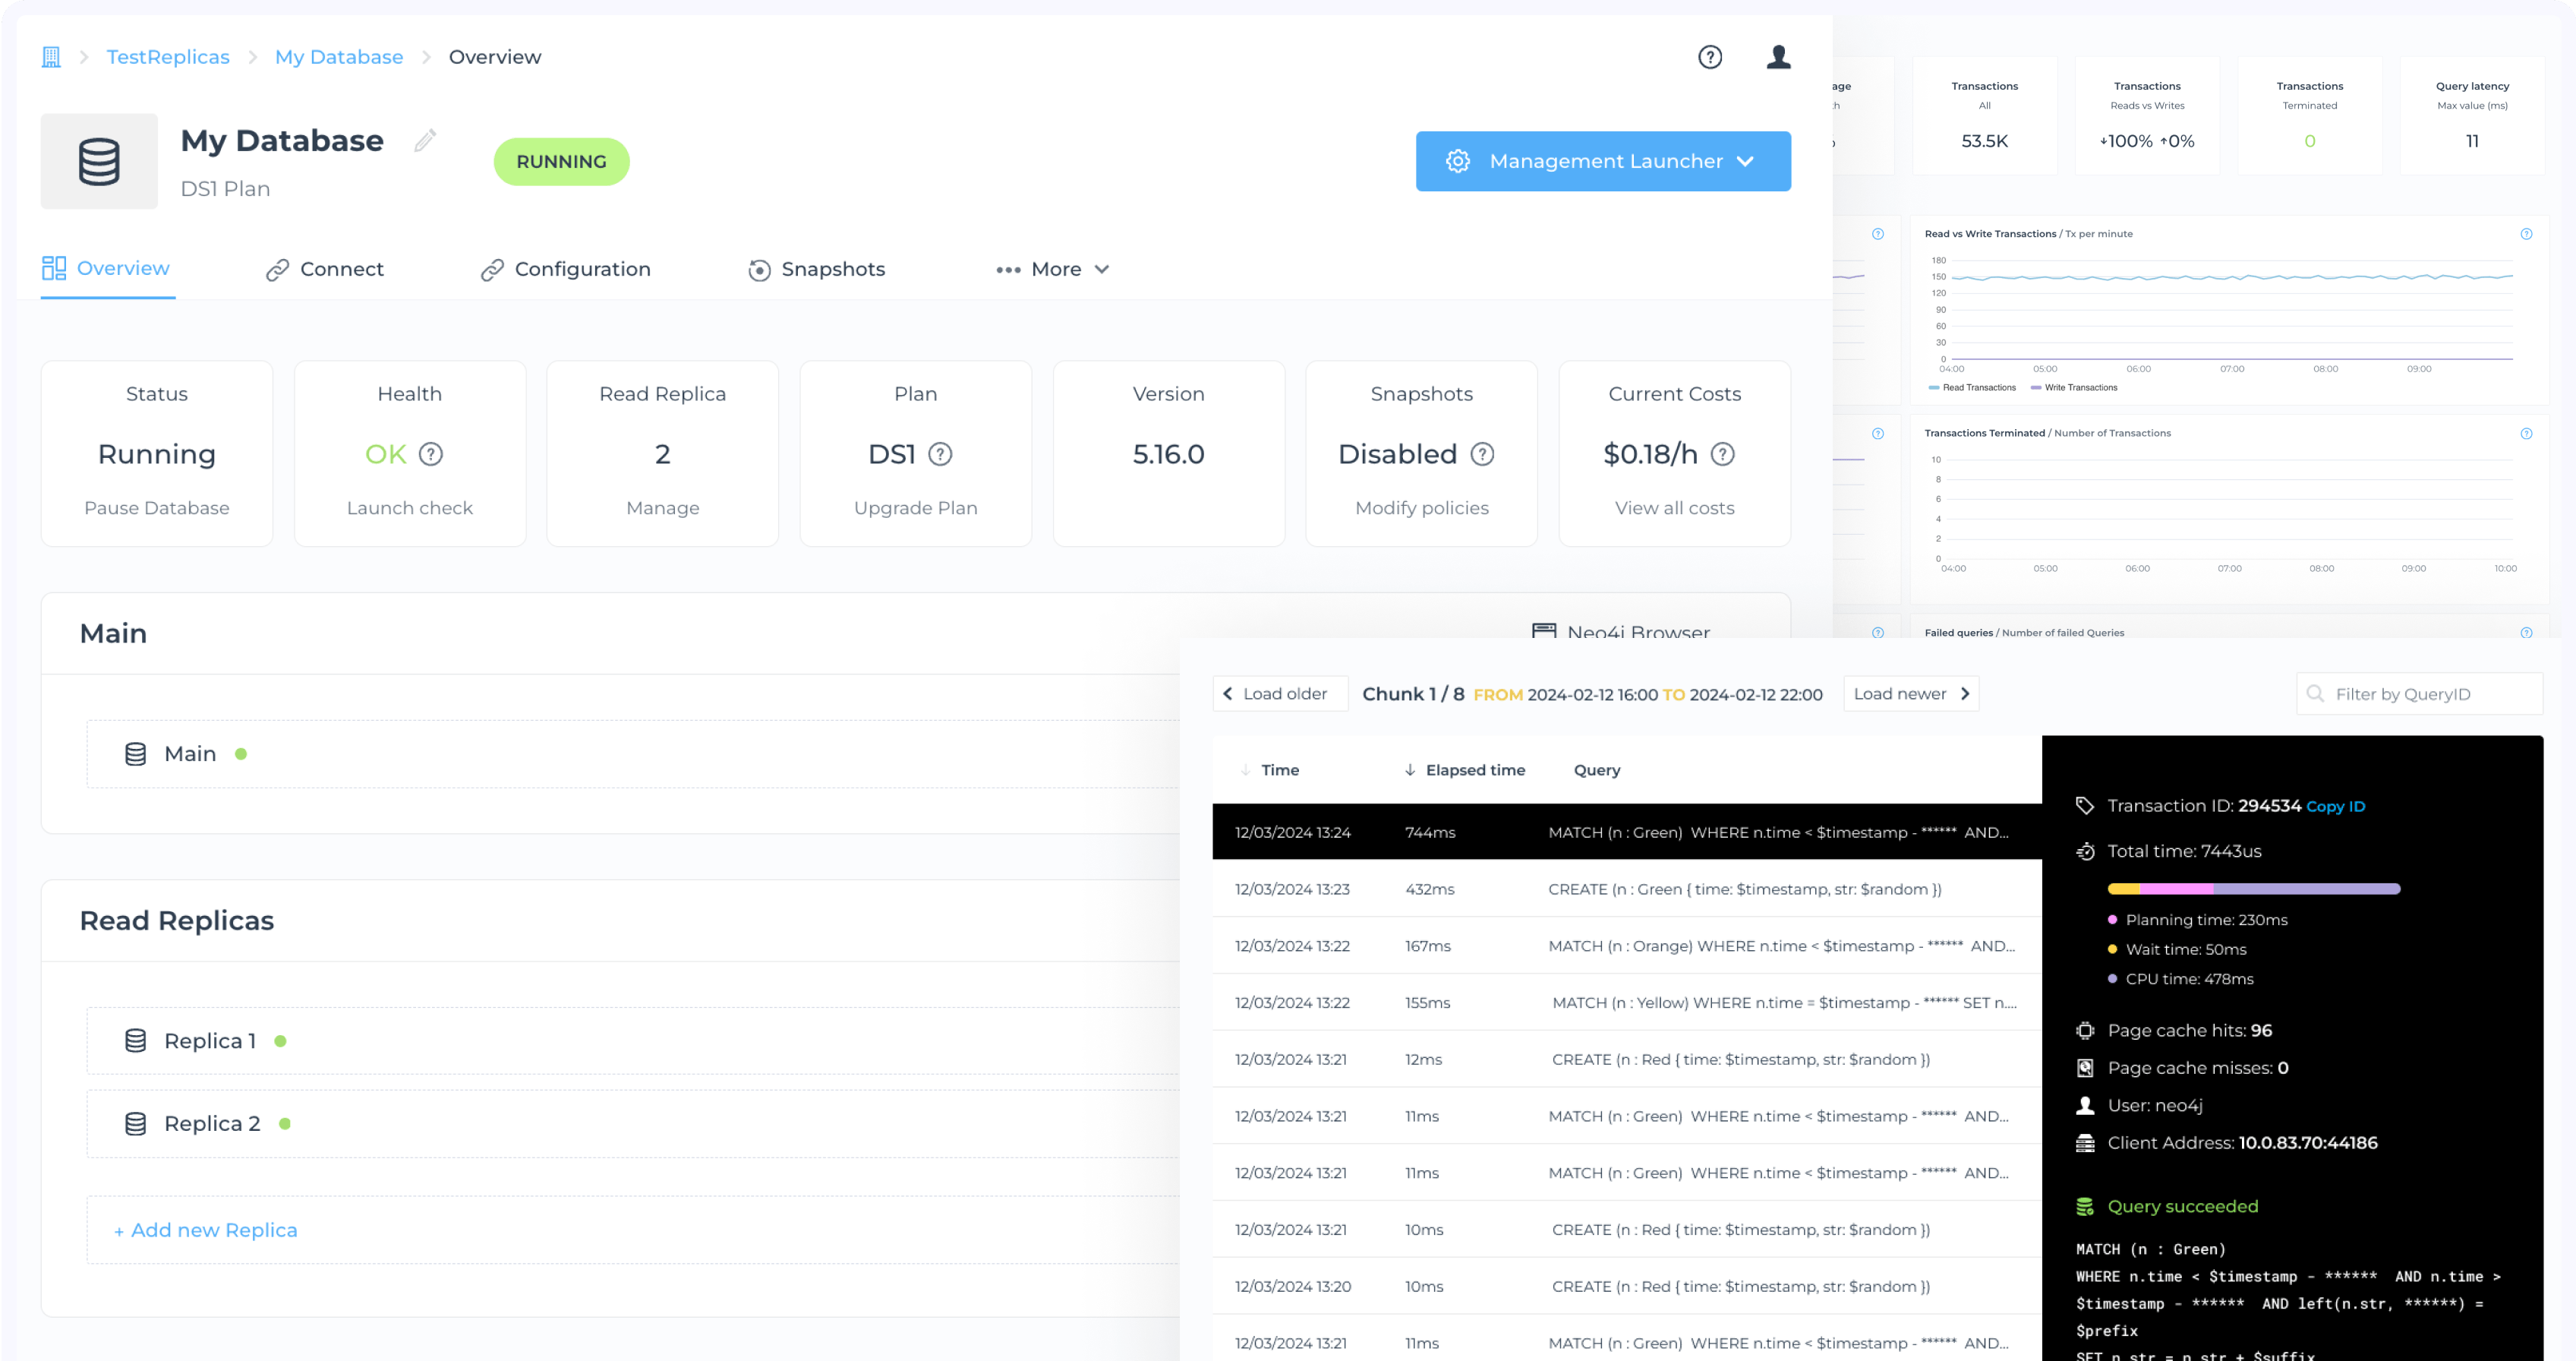
Query logs
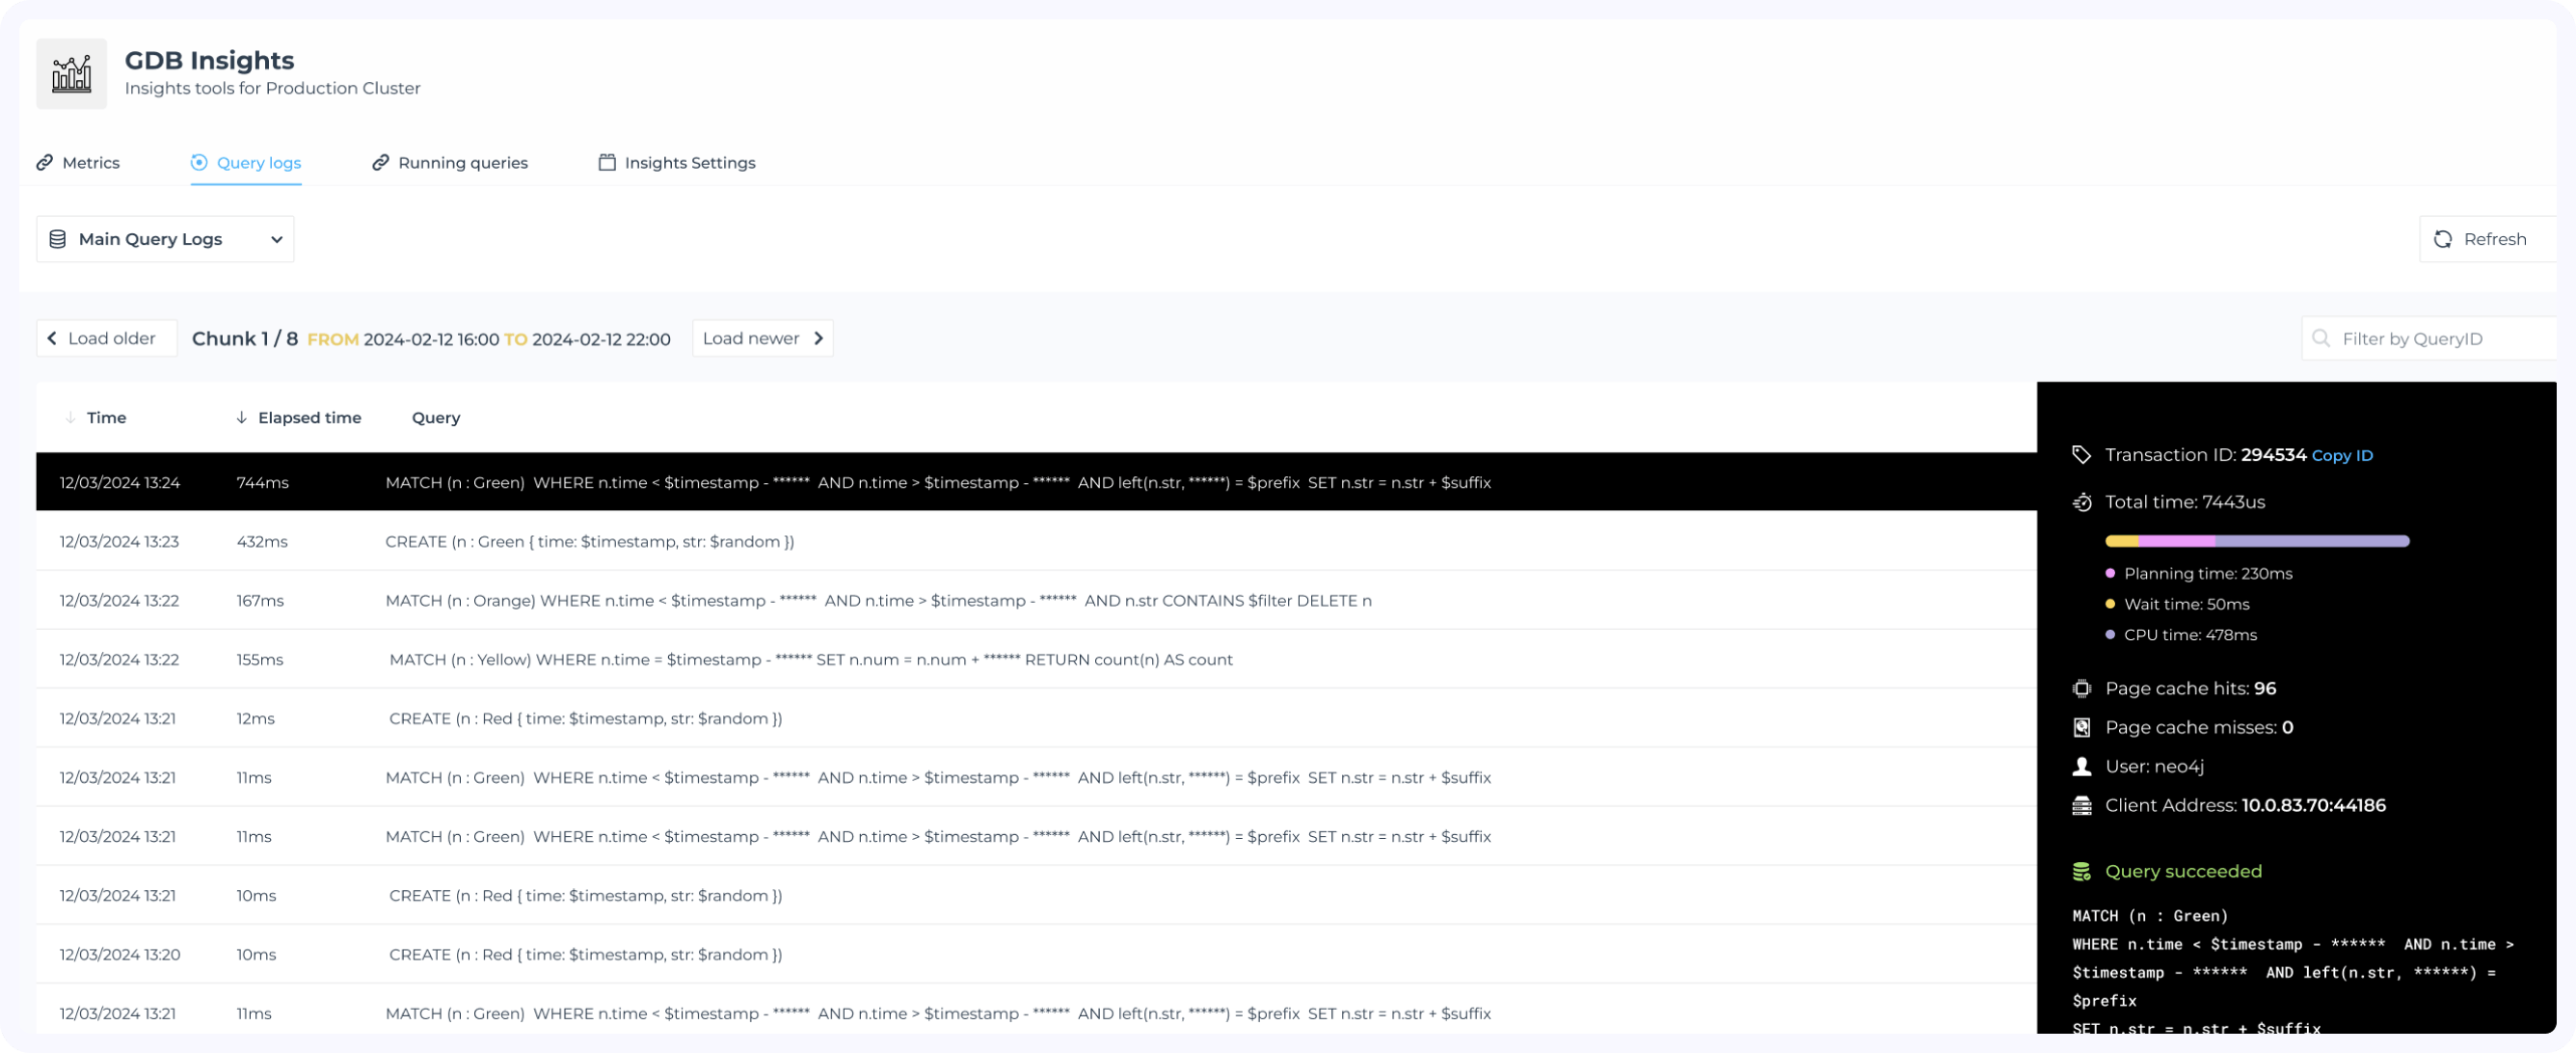
If you enable query logs for your database all your queries will get logged automatically. You will be able to search the query log and get all the information on past queries like execution time, client address, page cache hits, etc.
Database metrics
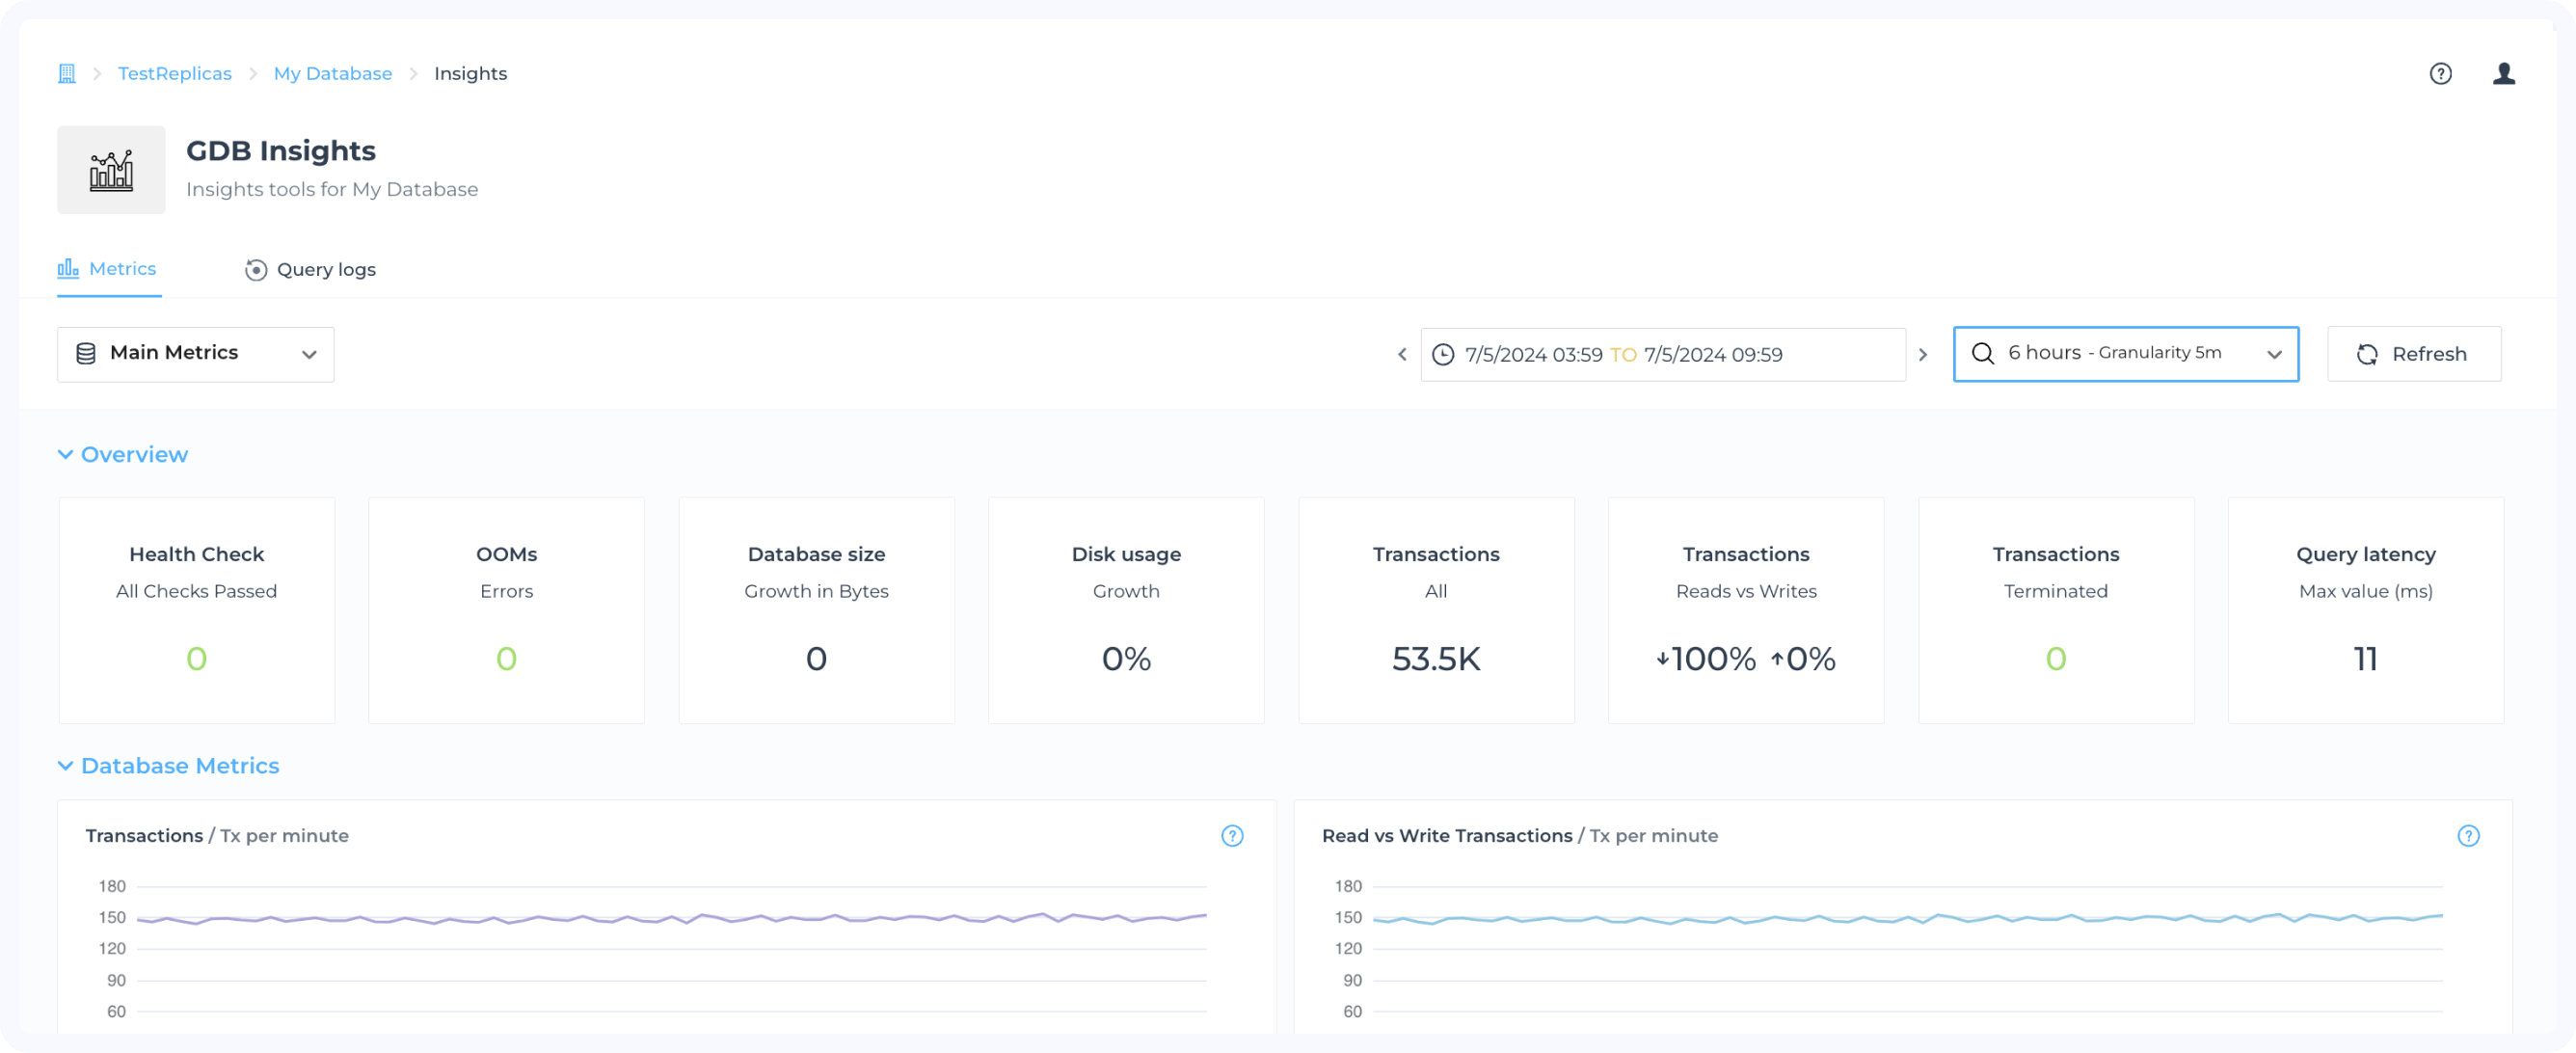
Apart from the server metrics, we have added a set of metrics that provide insights on how the database is performing. You can get information on transactions, queries, latencies, connections, etc.
Metrics can be additionally fetched via the public open metrics endpoint and used as source for your own Prometheus or Datadog service.
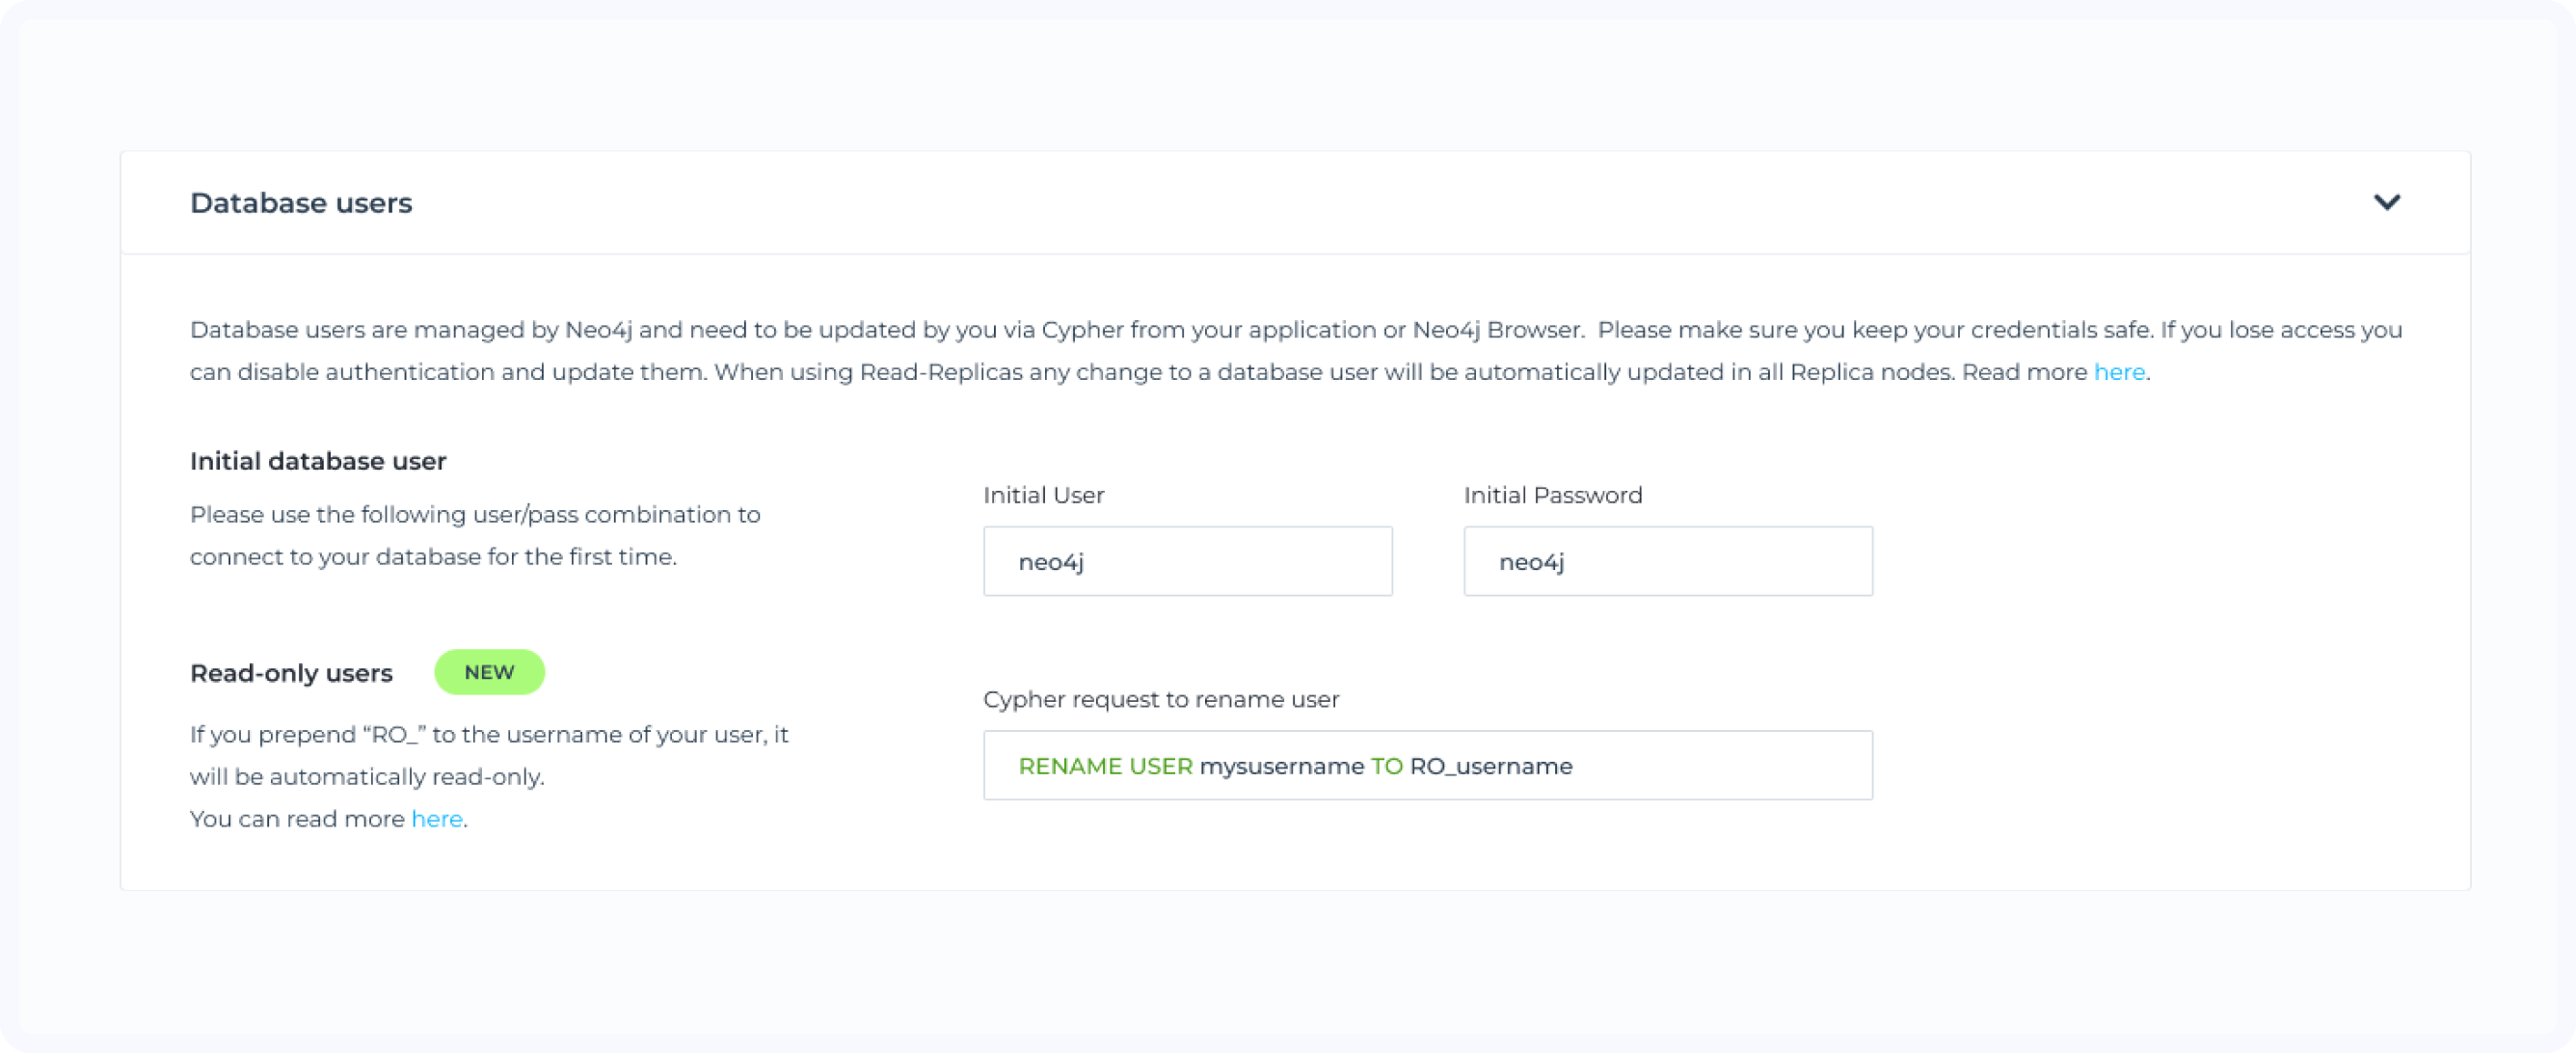
Read-only users
Read-only users is a new feature that will allow you to connect to the database with an user that has only read privileges.
This is specially interesting to allow access to clients with the peace of mind that no modification of your graph is possible.
