


Overview
GrapheneDB offers an endpoint for utilizing the open-source monitoring solution Prometheus. This endpoint enables you to oversee the underlying server of your deployment. By utilizing the metrics offered (such as CPU usage, memory utilization, and disk activity), you can gather insights into how the system’s load impacts the available resources.
Prometheus enables you to establish visual representations of metrics through charts, set up notification triggers, and more. Additionally, it facilitates integration with other tools like Grafana, along with services such as Datadog.
This article covers a basic setup of Prometheus, Grafana and Datadog, along with some example dashboards.
What is my Prometheus endpoint?
In the Insights Settings tab of Insighst area, we offer an endpoint for utilizing the open-source monitoring solution Prometheus. Important to note is that there are two endponts, MAIN and INTERNAL, and if VPC exists, the Prometheus endpoint to fetch metrics will not work if MAIN URL is used, it needs to be INTERNAL.
To locate these endpoints, please navigate to the Insights Settings > Metrics section.
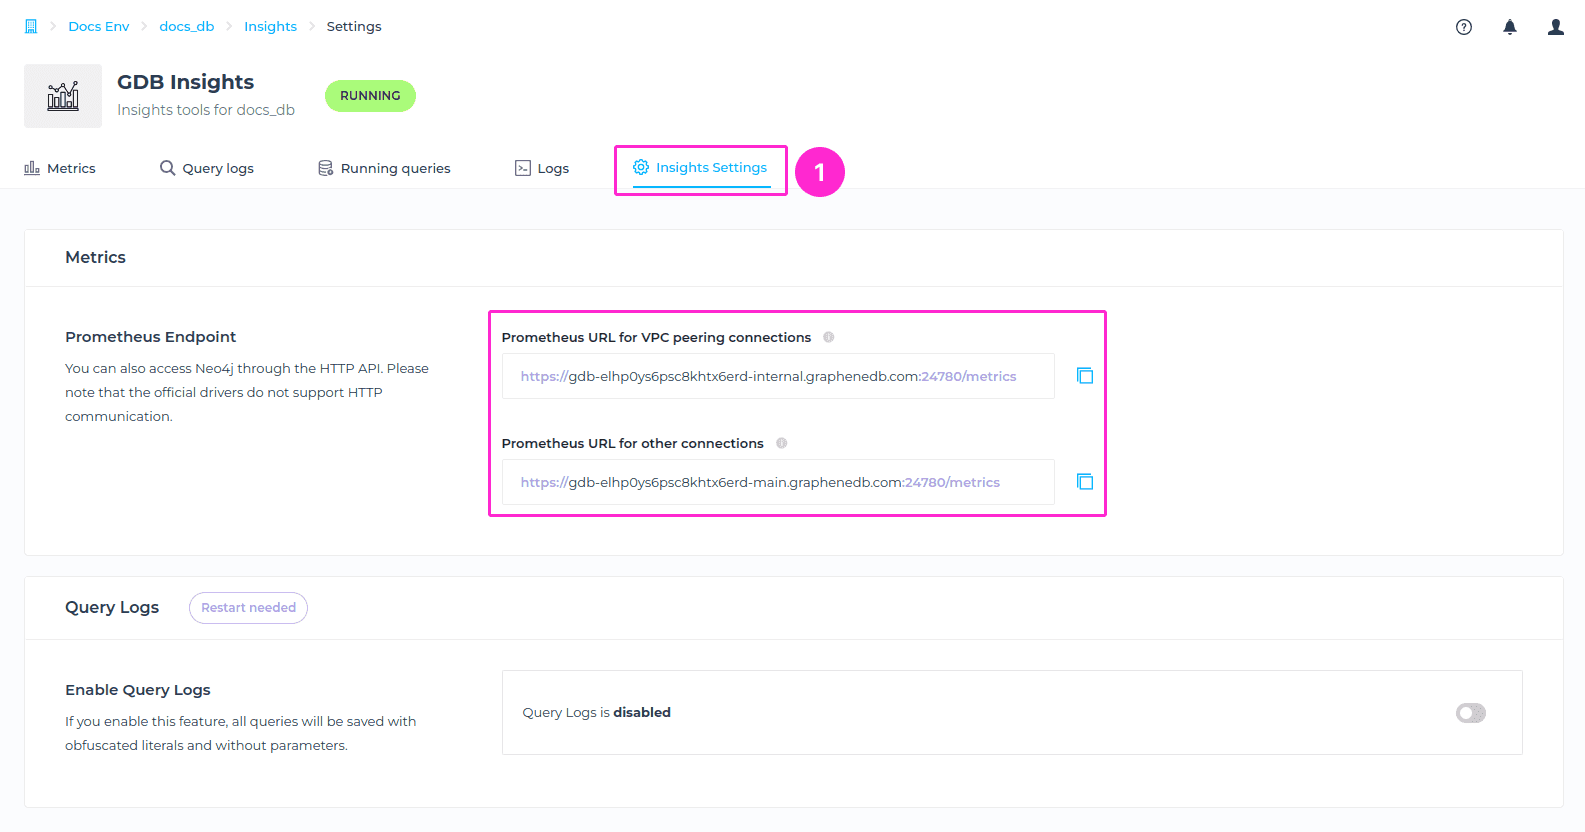
If you’d like to check if it is showing the metrics properly in the text format, you can just paste it into your regular browser URL and hit ENTER, and you should be able to access those metrics.
⚠️ Important
- You’ll need to whitelist your IP or add access to all IPs by adding 0.0.0.0/0 to the whitelist rule, to be able to access the endpoint, since the Environment access is disabled by default.
- If you don’t have any VPC set up, please use MAIN URL for setting up monitoring.
- If VPC is in place, please use INTERNAL URL for setting up monitoring.
Installing Prometheus
Download the latest release of Prometheus for your platform, then extract and run it, and complete the needed setup. You can find details on this in official Prometheus documentation.
Metrics reference
The available metrics are described in the following tables.
JVM metrics
| JVM metric | Description |
|---|---|
| jvm_memory_bytes_max | Max (bytes) of a given JVM memory area. |
| jvm_memory_bytes_init | Initial bytes of a given JVM memory area |
| jvm_memory_bytes_used | Used bytes of a given JVM memory area |
| jvm_memory_pool_bytes_used | Used bytes of a given JVM memory pool |
| jvm_gc_collection_seconds | Time spent in a given JVM garbage collector in seconds |
| jvm_threads_current | Current thread count of a JVM |
| process_open_fds | Number of open file descriptors |
| jvm_classes_loaded_total | The total number of classes that have been loaded since the JVM has started execution |
Station metrics
| Station metric | Description |
|---|---|
| station_cache_bytes | Current cache usage in bytes |
| station_cpu_load_average_delta | CPU load percent in the last ‘delta’ (1s) |
| station_cpu_usage_seconds_total | Cumulative cpu time consumed in seconds. |
| station_last_seen | Last time a station was seen by the exporter |
| station_memory_failures_total | Cumulative count of memory allocation failures |
| station_memory_usage_bytes | Current memory usage in bytes, including all memory regardless of when it was accessed |
| station_network_receive_bytes_total | Cumulative count of bytes received |
| station_network_transmit_bytes_total | Cumulative count of bytes transmitted |
| station_scrape_error | 1 if there was an error while getting station metrics, 0 otherwise |
| station_spec_cpu_period_us | CPU period of the station |
| station_spec_cpu_quota_us | CPU quota of the station |
| station_spec_cpu_shares | CPU shares of the station |
| station_spec_memory_limit_bytes | Memory limit for the station |
| station_spec_memory_soft_limit_bytes | Memory soft limit for the station |
| station_uptime_seconds | Station uptime in seconds |
Storage metrics
| Storage metric | Description |
|---|---|
| database_data_folder_size | Total databases size in bytes (includes system db) |
| database_plugins_folder_size | Plugins size in bytes |
| database_device_size | Total EBS size in bytes |
| database_device_used_size | Total size in bytes used by Neo4j |
| database_errors | Errors |
| database_gc_stoptheworld_events_total | Total number of “Stop-the-World” events that occur during garbage collection (GC) in a database system |
| database_gc_stoptheworld_pausetime_millis_total | Measures the total accumulated time, in milliseconds, that the database has spent in “Stop-the-World” pauses during garbage collection (GC) |
Database metrics
| Database metric | Description |
|---|---|
| database_bolt_messages_failed_total | The total number of messages that have failed while processing |
| database_bolt_connections_idle_count | The number of Bolt connections that are not currently executing Cypher or returning results |
| database_bolt_connections_closed_total | The total number of Bolt connections closed since startup |
| database_bolt_messages_received_total | The total number of messages received via Bolt since startup |
| database_bolt_connections_opened_total | The total number of Bolt connections opened since startup |
| database_bolt_messages_done_total | The total number of Bolt messages that have completed processing whether successfully or unsuccessfully |
| database_bolt_messages_started_total | The total number of messages that have started processing since being received |
| database_bolt_connections_running_count | The number of Bolt connections that are currently executing Cypher and returning results |
| database_transaction_rollbacks_write_total | The total number of rolled back write transactions |
| database_transaction_commited_read_total | The total number of committed read transactions |
| database_transaction_peak_concurrent | The highest peak of concurrent transactions |
| database_transaction_terminated_write_total | The total number of terminated write transactions |
| database_transaction_commited_write_total | The total number of committed write transactions |
| database_transaction_terminated_read_total_count | The total number of terminated read transactions |
| database_transaction_active_write_count | The number of currently active write transactions |
| database_transaction_terminated_started_total | The total number of started transactions |
| database_transaction_rollbacks_read_total | The total number of rolled back read transactions |
| database_transaction_active_read_count | The number of currently active read transactions |
| database_query_execution_failure_total | Count of failed queries executed |
| database_query_execution_success_total | Count of failed queries executed |
| database_counters_properties_total | The total number of properties in the database |
| database_counters_relationships_total | The total number of relationships in the database |
| database_counters_labels_total | The total number of labels in the database |
| database_counters_nodes_total | The total number of nodes in the database |
| database_query_execution_latency_stddev_millis | The standard deviation for query execution latency |
| database_query_execution_latency_millis_min | The Min value for query execution latency |
| database_query_execution_latency_mean_millis | The Mean value for query execution latency |
| database_query_execution_latency_millis_max | The Max value for query execution latency |
OOM metrics
| OOM metric | Description |
|---|---|
| database_oom_by_kind_count | Count of database OOM’s by kind |
| database_oom_count | Count of database OOM’s |
Configure with Grafana
⚠️ Important
- If you don’t have any VPC set up, please use MAIN URL for setting up monitoring.
- If VPC is in place, please use INTERNAL URL for setting up monitoring.
Here’s a step-by-step guide for configuring Grafana to visualize some of the key metrics from your GrapheneDB instance. This example will focus on setting up a dashboard with a few basic yet informative metrics.
Configure Prometheus for scraping GDB metrics
You first need to open the Prometheus configuration file (/etc/prometheus/prometheus.yml) in a text editor:
sudo nano /etc/prometheus/prometheus.ymlNow, add a new job for scraping your GrapheneDB metrics. Please make sure to replace YOUR_PROMETHEUS_ENDPOINT_FROM_GRAPHENEDB with the actual Prometheus endpoint section in GDB Console. Please exclude /metrics from URL, because you are already specifying metrics path as /metrics. Your file should look like this:
---
global:
  scrape_interval: 15s

scrape_configs:
  - job_name: 'prometheus'
    static_configs:
      - targets: ['localhost:9090']

  - job_name: 'graphenedb'
    scheme: https
    metrics_path: /metrics
    static_configs:
      - targets: ['YOUR_PROMETHEUS_ENDPOINT_FROM_GRAPHENEDB']
Save the changes and exit the text editor. Restart Prometheus to apply the new configuration:
sudo systemctl restart prometheusAnd check the status, that should show as Active:
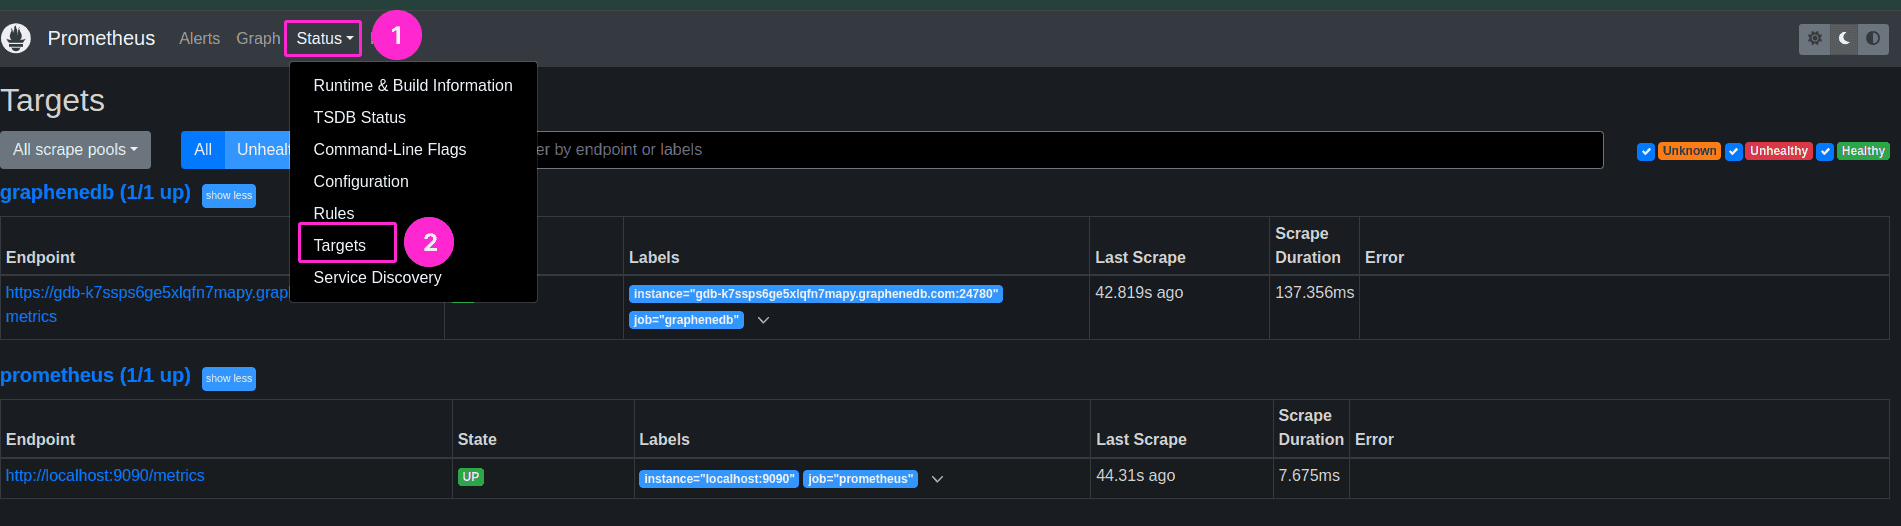
sudo systemctl status prometheusYou can now verify in Prometheus directly by opening http://localhost:9090/ > Status > Targets > All. You should be able to see your GrapheneDB Prometheus endpoint listed there.
Add a Prometheus data source in Grafana
Start by logging in to your Grafana instance. Once logged in, go to Home > Connections > Data sources > Add data source > choose Prometheus from the list.
Next, configure your Prometheus connection by pasting the URL to your Prometheus instance, e.g., http://localhost:9090, in the Prometheus server URL field. Click on Save and Test button.
You should be able to see Successfully queried the Prometheus API. message.
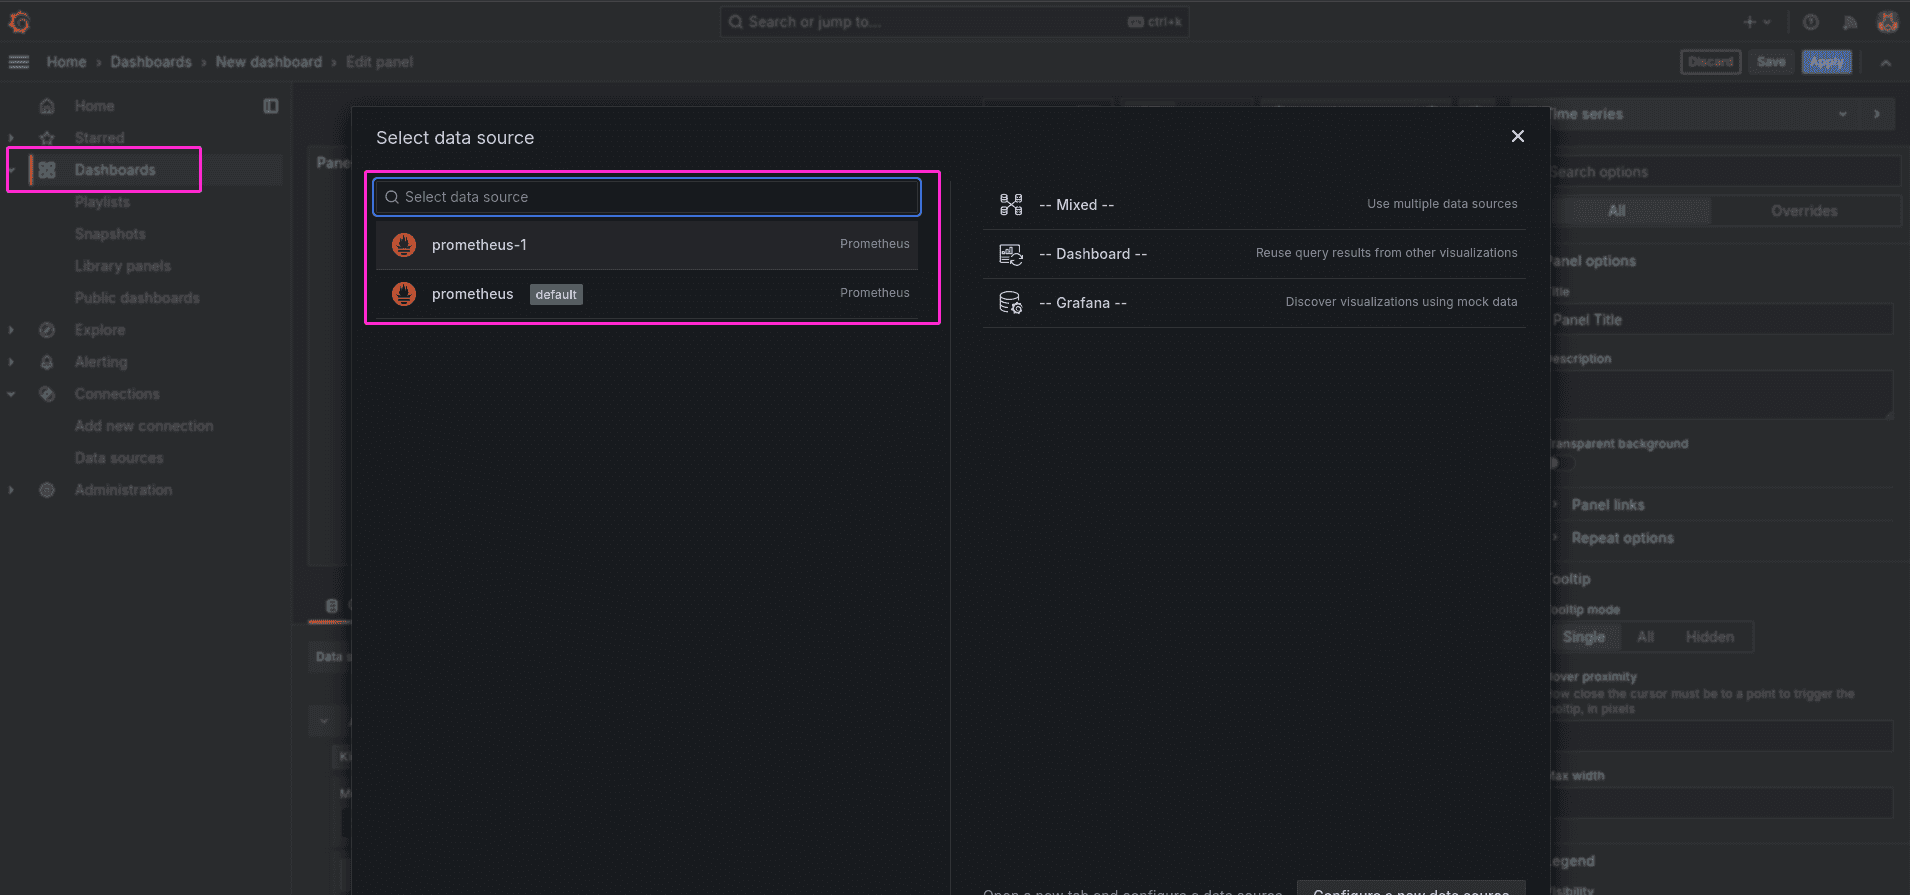
Create a dashboard
Now, to start creating Dashboard, navigate to the Dashboards from sidemenu in Grafana, and click on Add Visualization button. Next, Select Prometheus from dropdown.
You can now choose which metrics from available ones you would like to add to queries for the Dashboard. The list of available metrics can be found in previous setion here.
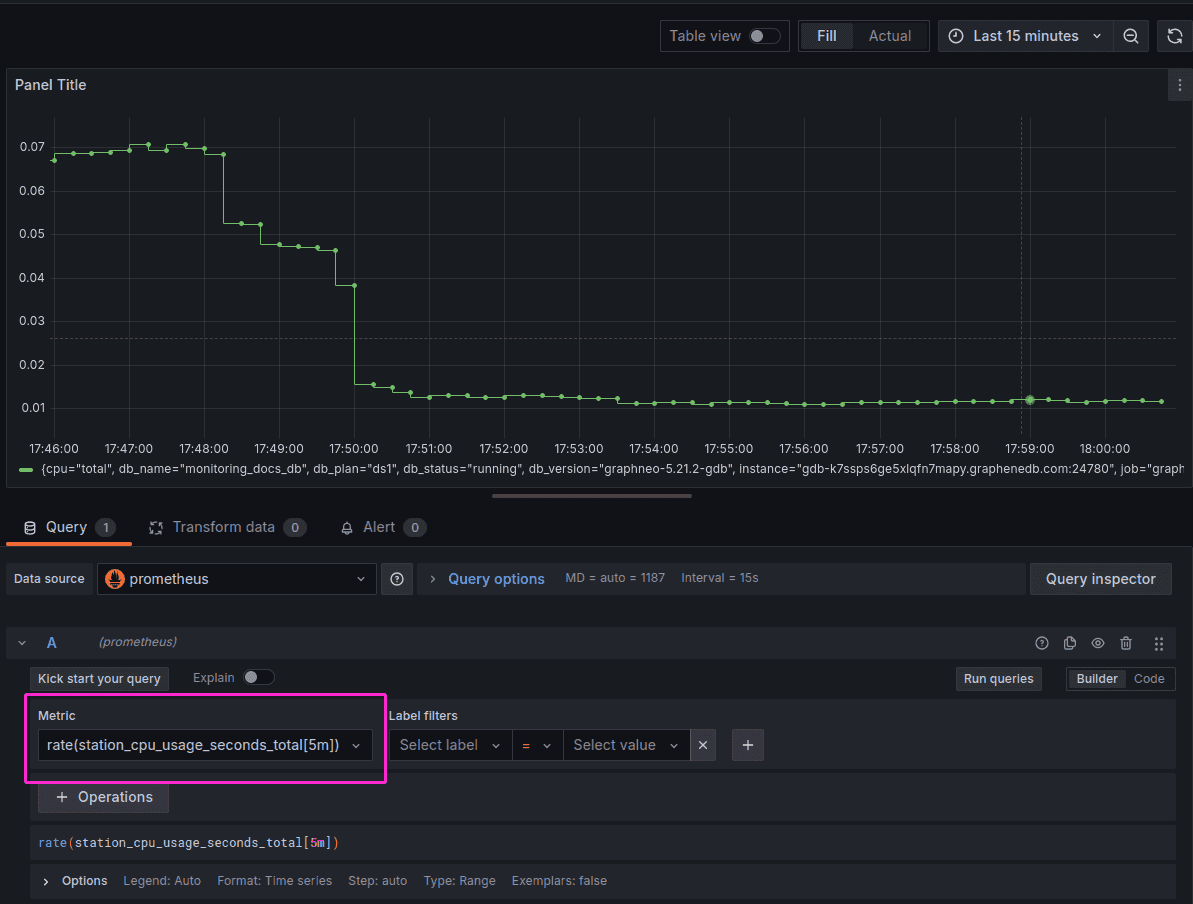
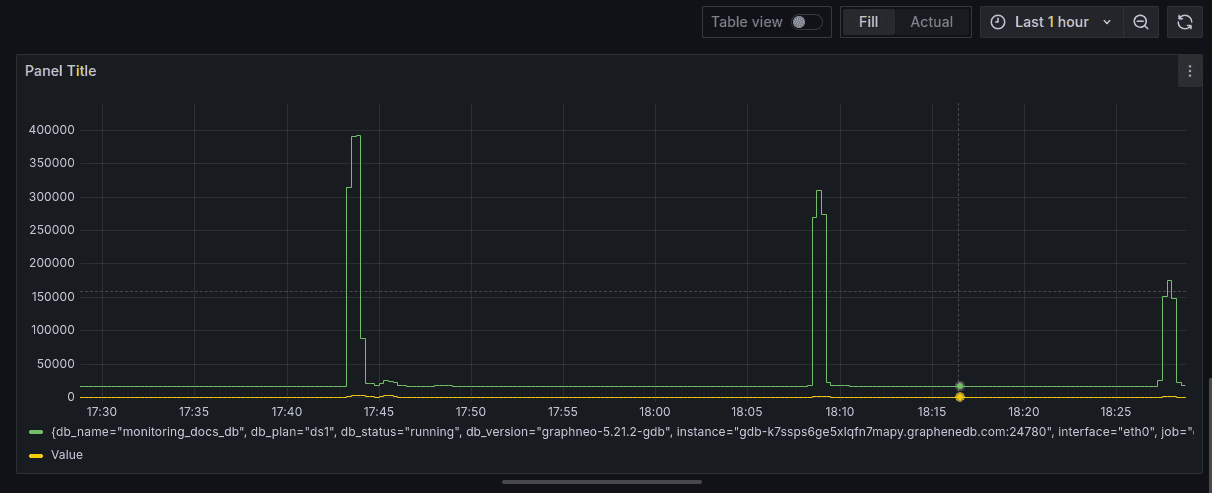
In this example below, we will setup a dashboard which shows the CPU usage over time, which helps you understand how much CPU is being used and whether there are any spikes or unusual patterns.
Start by clicking on Add query button and adding the following as metric: rate(station_cpu_usage_seconds_total[5m]). You should be able to see data populating into your Dashboard.
In the next example, we will visualize the network traffic in terms of bytes received and transmitted over time. We will use the following queries:
rate(station_network_receive_bytes_total[$__rate_interval])
rate(station_network_transmit_bytes_total[$__rate_interval])
Overlaying these two metrics allows us to compare inbound and outbound traffic directly, providing a clear view of network activity.
By following these steps, you can successfully set up Grafana to monitor your GrapheneDB instance. If you require any assistance or have any questions, feel free to Open a Support Case.
Configure with Datadog
⚠️ Important
- If you don’t have any VPC set up, please use MAIN URL for setting up monitoring.
- If VPC is in place, please use INTERNAL URL for setting up monitoring.
Here’s a step-by-step guide on how to configure Datadog Agent. This example will focus on setting up a dashboard with a few basic yet informative metrics.
Installing Datadog
You can get official information on installation steps related to your operating system in the official Datadog docs.
Ensure that the API key you’re using has the correct permissions. You might need to add the Remote Configuration Read permission to the API key, and here’s how you can do it.
Log in to the Datadog web interface. Navigate to Organization Settings > API Keys > Check if Remote Config is enabled. If not, go to the Organization Settings > Security > Remote Configuration and configure the agent for remote configuration enabling.
Please refer to the official Datadog docs for details intructions.
Configure the OpenMetrics conf file
Configure the openmetrics.d/conf.yaml file to ensure it scrapes the necessary metrics.
Open the configuration file:
sudo nano /etc/datadog-agent/conf.d/openmetrics.d/conf.yamlUpdate the content to include the metrics you want to scrape. Replace YOUR_PROMETHEUS_ENDPOINT_FROM_GRAPHENEDB with your actual Prometheus endpoint from GrapheneDB. In the example below, the metrics we want to monitor are specified. You can get the Metrics reference easily, in this section here.
---
init_config:

instances:
  - openmetrics_endpoint: YOUR_PROMETHEUS_ENDPOINT_FROM_GRAPHENEDB
    namespace: 'graphenedb'
    metrics:
      - database_data_folder_size
      - database_device_used_size
      - database_device_size
      - database_oom_count
      - station_memory_usage_bytes
      - station_network_receive_bytes_total
      - station_network_transmit_bytes_total
      - station_last_seen
      # Add more explicit metrics if needed
After updating the configuration, restart the Datadog Agent to apply the changes:
sudo systemctl restart datadog-agentVerify if the Datadog Agent is running correctly and scraping Prometheus metrics with:
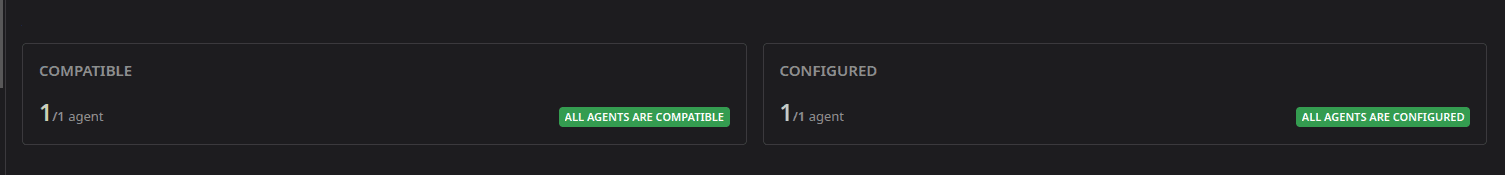
sudo datadog-agent statusHere you would look for Collector section > openmetrics section, and confirm that status is OK for it. It should show openmetrics loaded correctly, like in our example below:
openmetrics (6.0.0)
Instance ID: openmetrics:graphenedb:9178bf29f01bacdc [OK]
Total Runs: 30
Metric Samples: 6, Total: 180
Events: 0, Total: 0
Service Checks: 1, Total: 30
Average Execution Time : 1.422s
Last Execution Date : 2024-11-08 10:29:37 CET / 2024-11-08 09:29:37 UTC (1731058177000)
Last Successful Execution Date : 2024-11-08 10:29:37 CET / 2024-11-08 09:29:37 UTC (1731058177000)
Explore metrics in Datadog
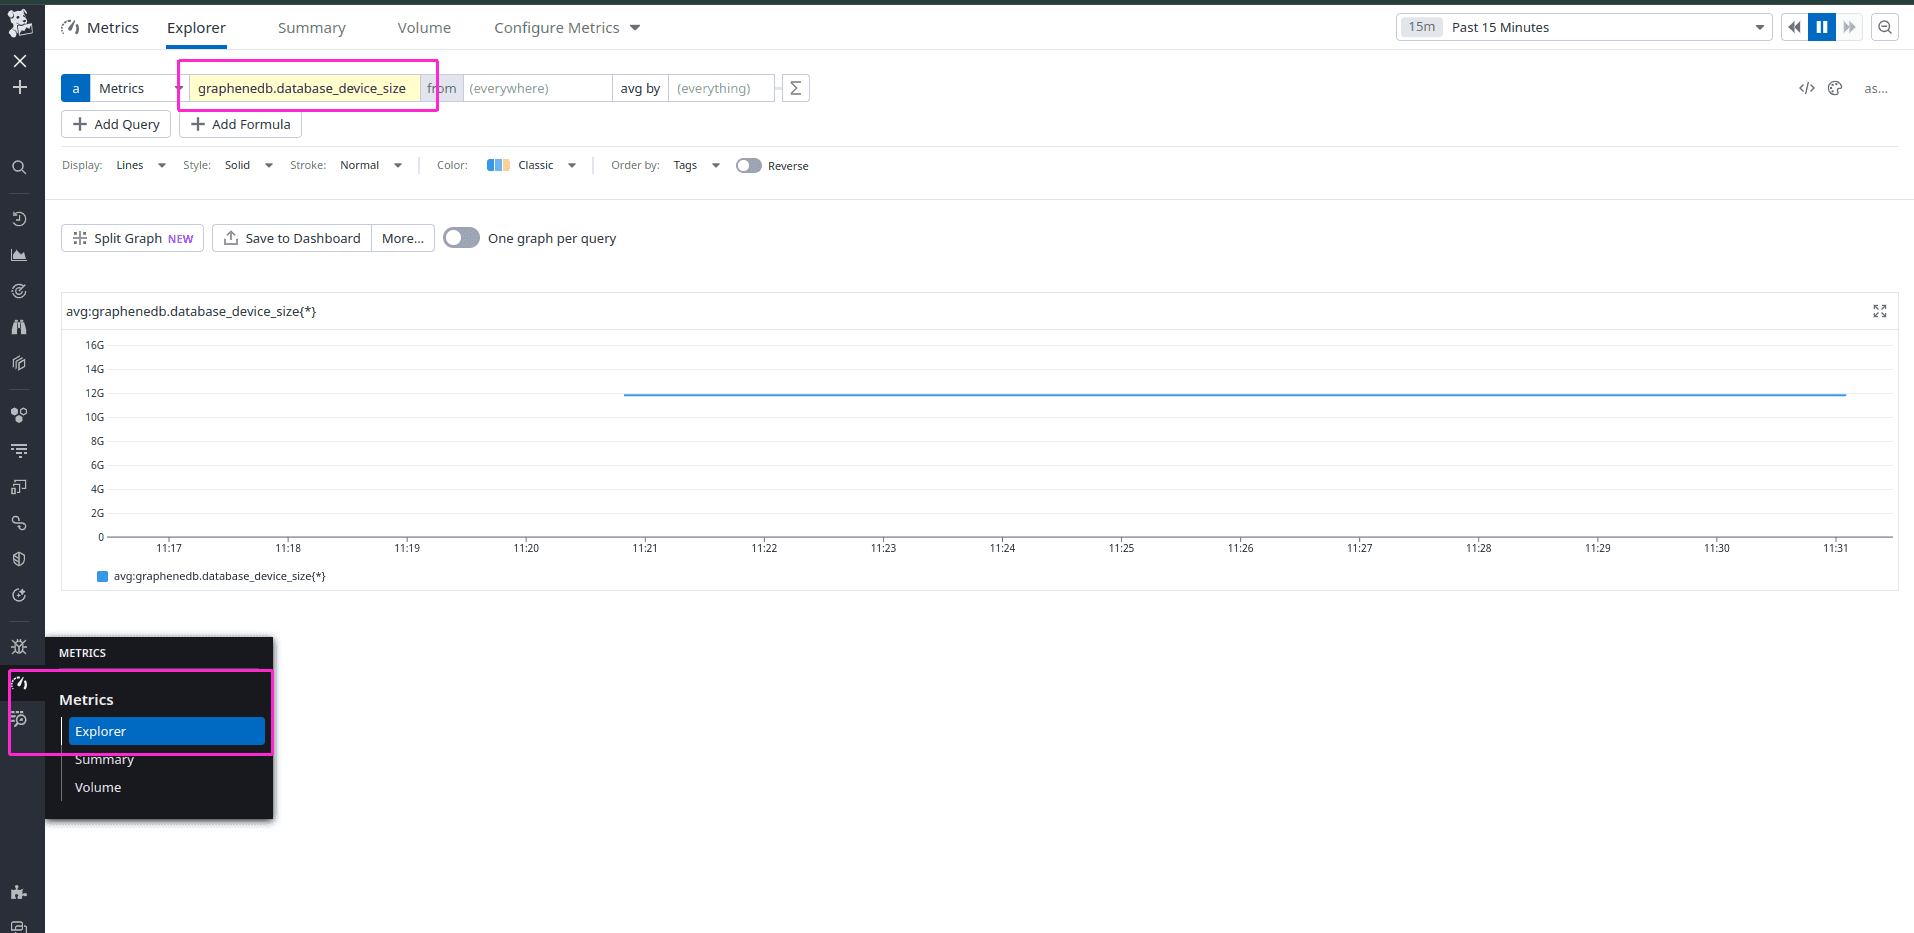
Once the Agent is running and scraping metrics, log in to your Datadog account and navigate to Metrics > Explorer to view the data from Prometheus.
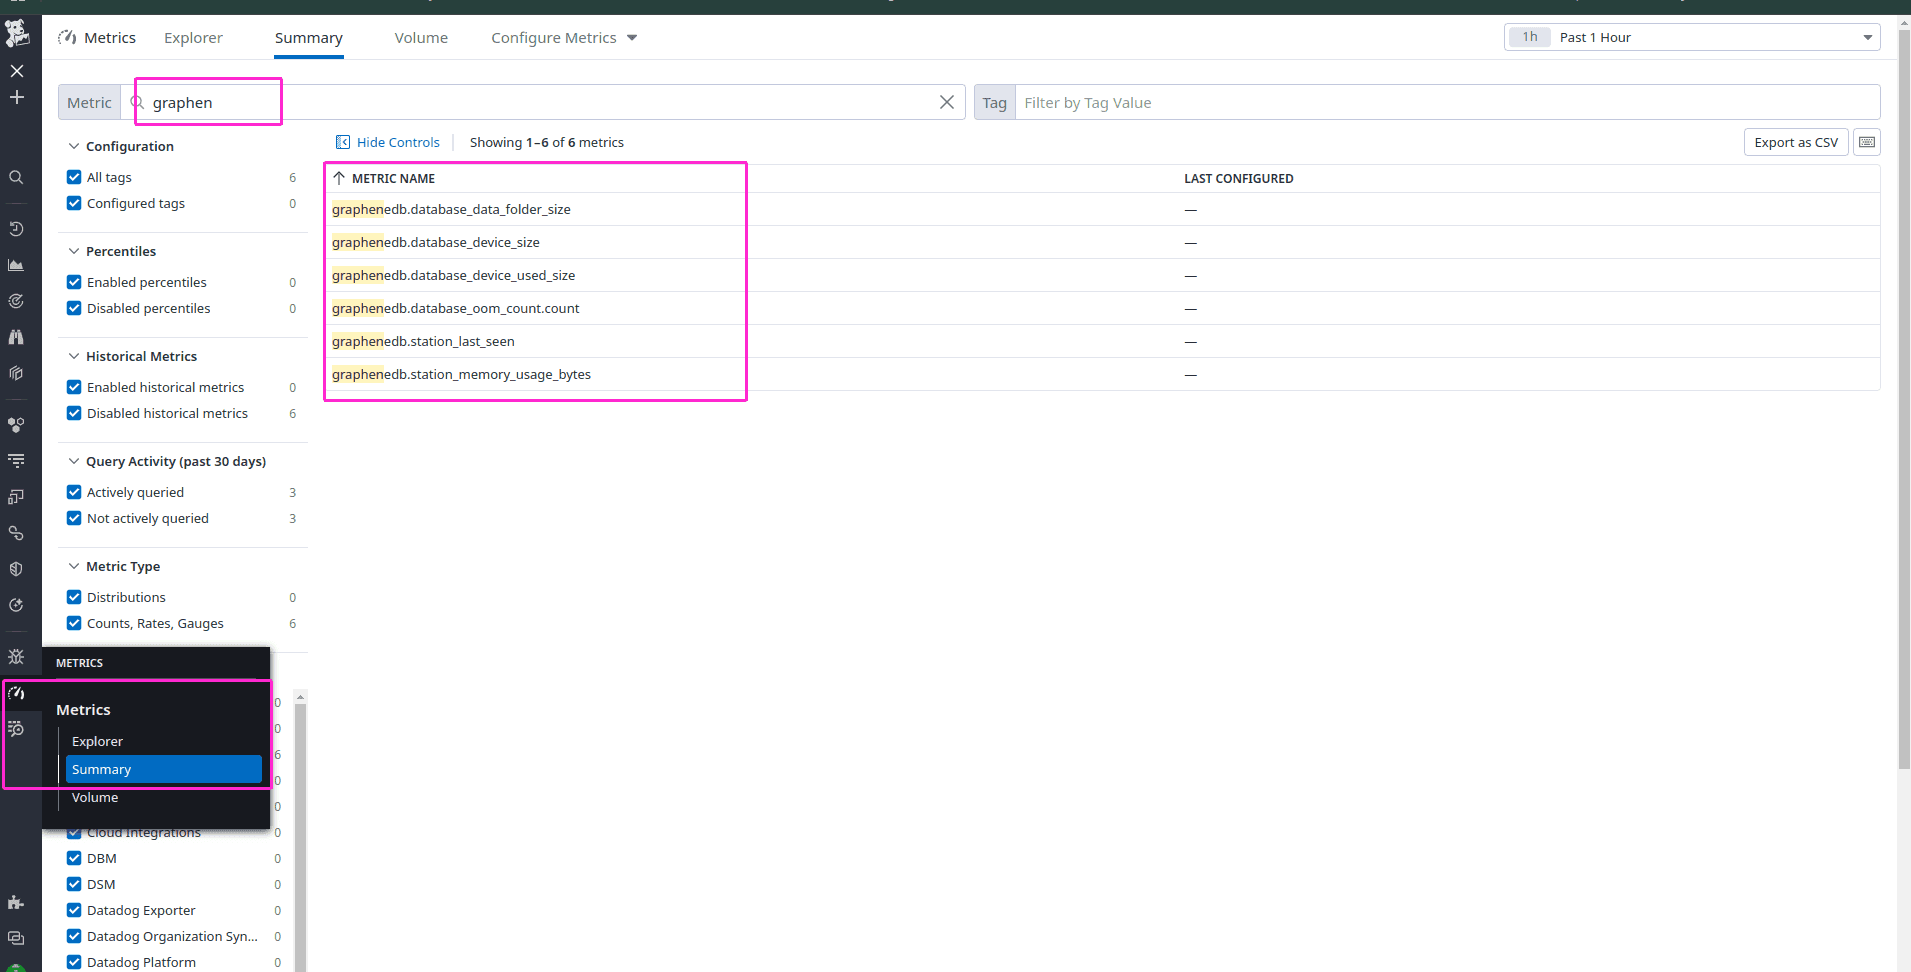
In the Summary tab, you can search for the metrics you’ve configured, such as graphenedb.database_data_folder_size or graphenedb.database_device_used_size, to verify that they are present.
Create a dashboard
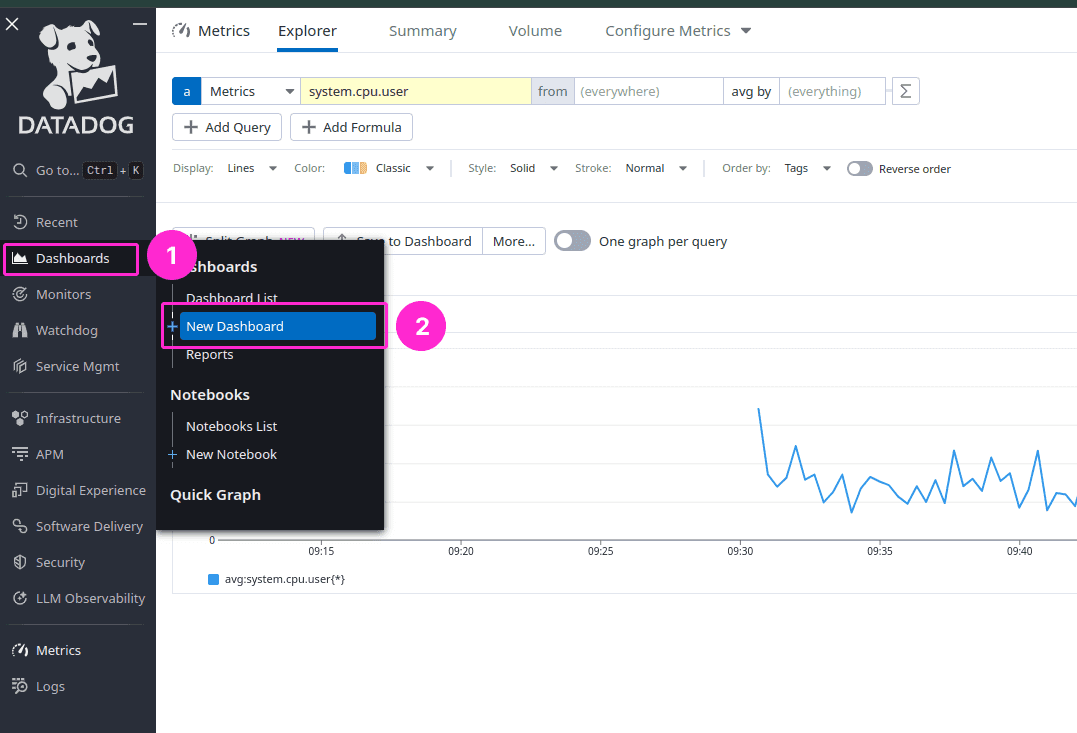
From the Datadog sidebar, click on Dashboards, then select New Dashboard.
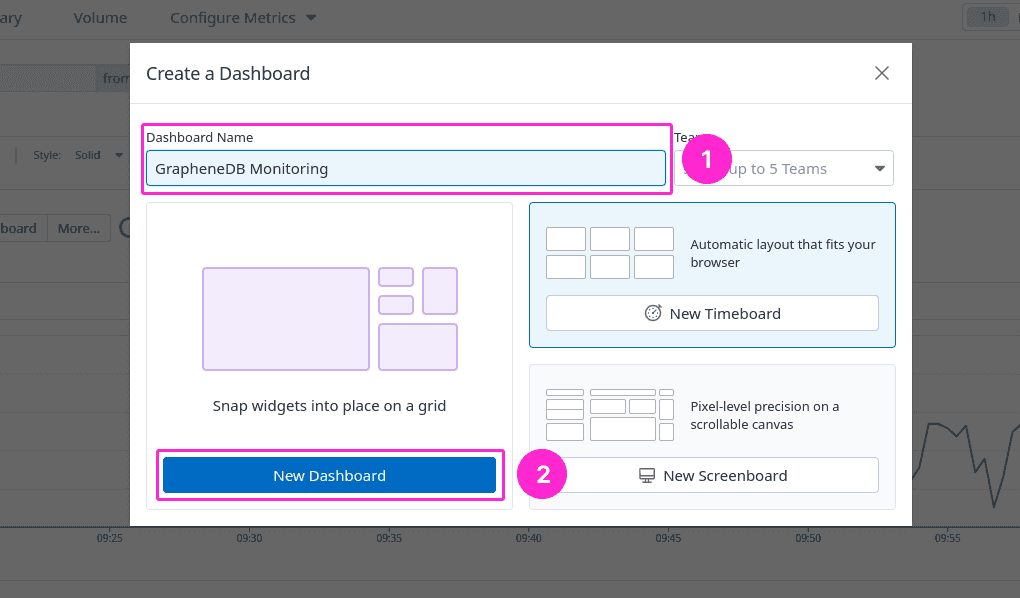
Give your dashboard a name, such as “GrapheneDB Monitoring”, and click Create Dashboard.
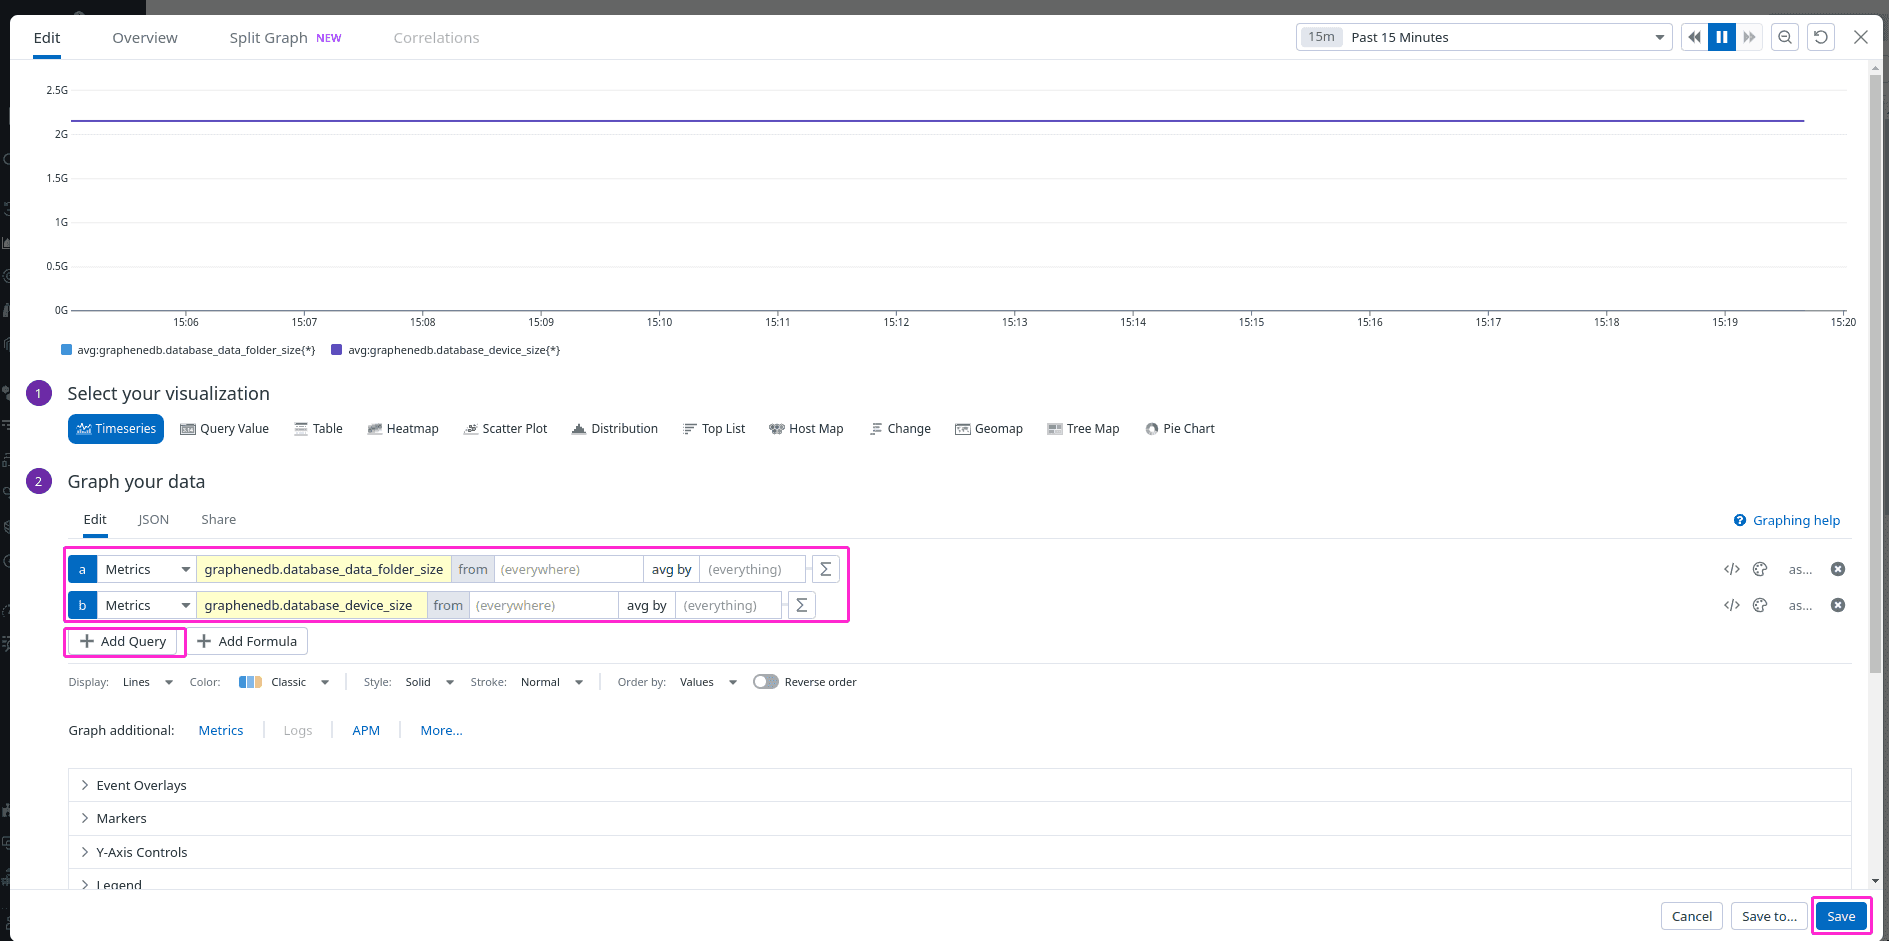
In our example below, we will add few key storage metrics from our GrapheneDB Prometheus endpoint, such as database_data_folder_size and database_device_used_size. By monitoring the growth trends of these metrics, you assess how much of the disk space is occupied by the database relative to the total disk space used.
When searching for metrics, please make sure to include graphenedb. prefix, or what ever namespace you have given in your openmetrics conf file. Example would be graphenedb.database_data_folder_size, graphenedb.database_device_size etc.
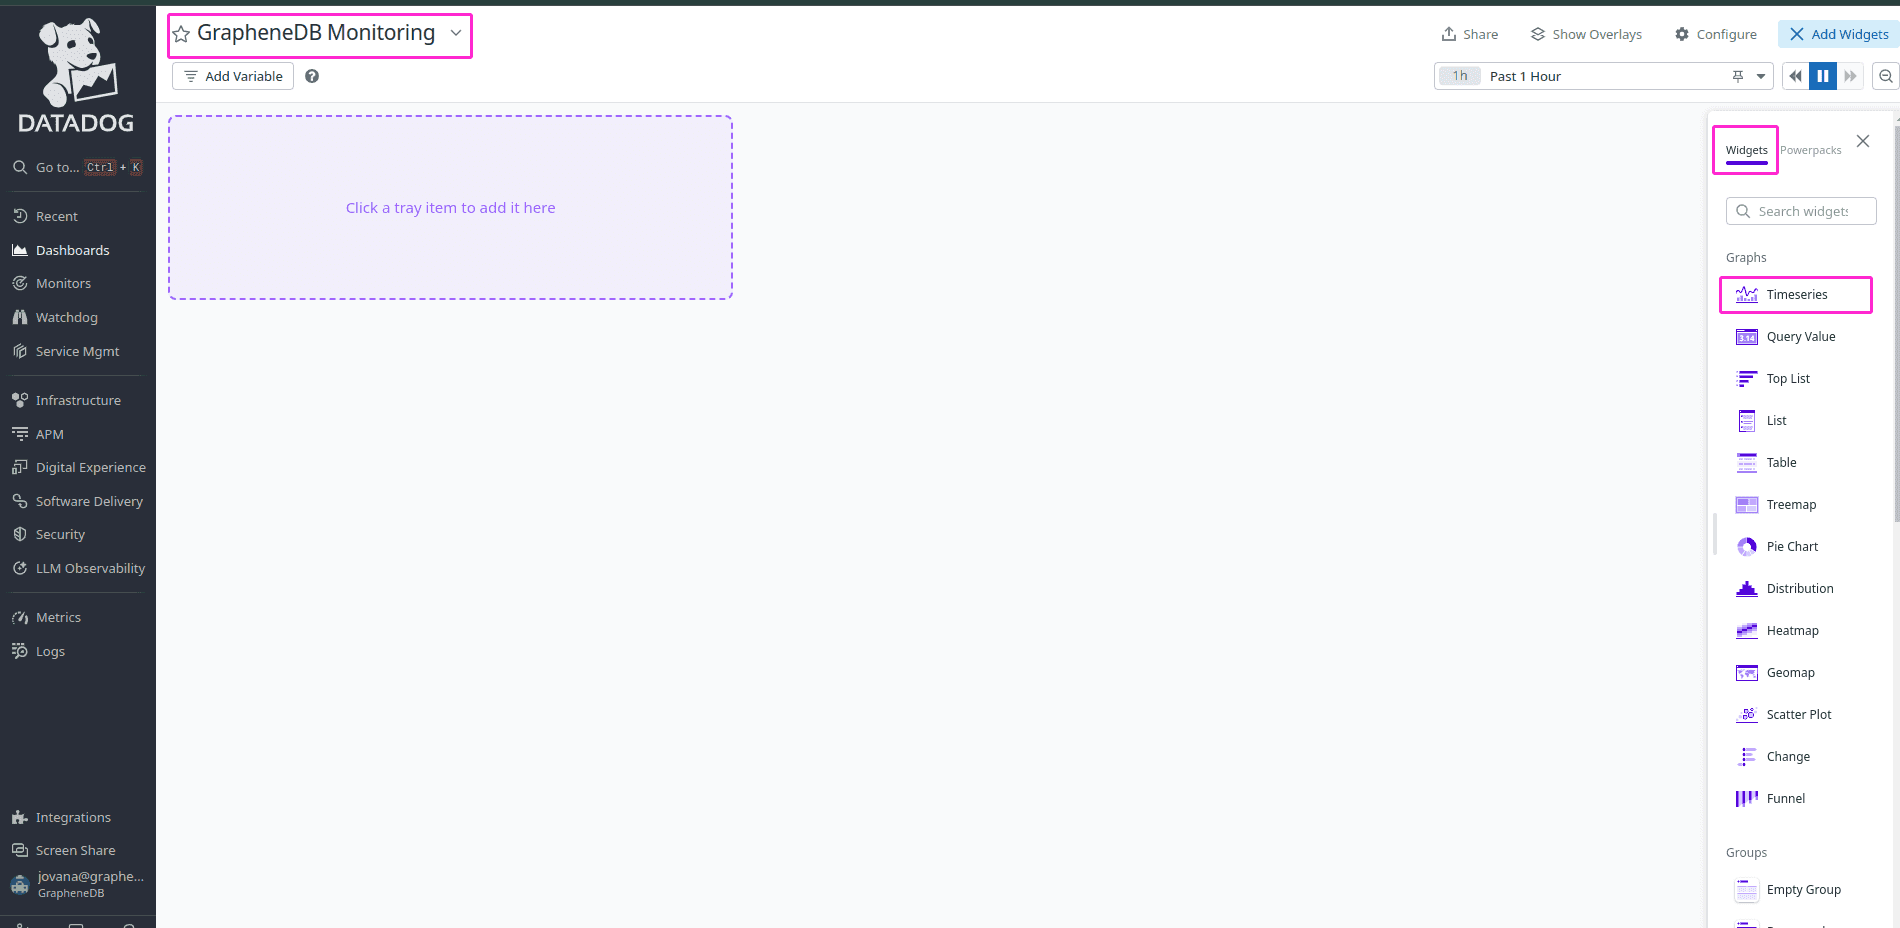
Now, to create our dashboard info, navigate to the Widgets > Timeseries to visualize the metrics over time.
Next, click on Add Query button > and either paste or search for the metric you want to visualize. To add a next one for this dashboard, simply click on Add Query button again and select different desired metric. After you are happy, you can click on Save button, to save your Dashboard.
By following these steps, you can successfully set up Datadog to monitor your GrapheneDB instance using OpenMetrics. If you require any assistance or have any questions, feel free to Open a Support Case.